อ่านรายละเอียดเพิ่มเติม


 01.07.2022 12:02 PM
Let's look at how well the British pound sterling has performed when paired with the US dollar since the market ended trading for the first month of summer yesterday, as you are probably aware. But first, a little background on the oldest period. Naturally, trading every month is impossible due to the enormous price fluctuations and the challenging nature of identifying the best entry and exit moments. However, it is important to consider the candle that appears, its closing price, and the maximum and lowest values following each close of monthly trading. All those mentioned above can assist in understanding the course's future path at the beginning of the month.
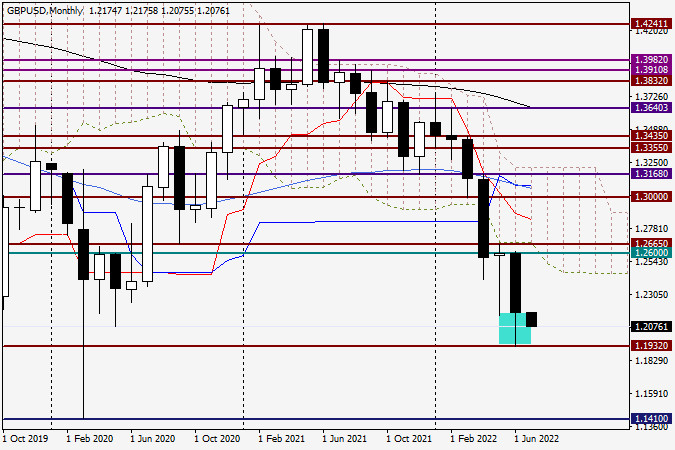
Monthly
Last month, the pound experienced intense selling pressure and dropped as far as 1.2000. The GBP/USD pair did, however, manage to find solid support at 1.1932, after which it entered the correction phase. As a result, the June auction ended at the price of 1.2174, and the candle's lower shadow was rather remarkable. If you look at the history, and the monthly chart is ideal for this, you can see that the pair has frequently established strong support at about 1.2000, following which it has sprinted in the direction of the north. The same thing occurred in 2020, 2019, and 2017. Although the pair fell as low as 1.1410 in 2020, it was able to significantly cut losses by closing the March candle of this year at 1.2412.
I want to reiterate that the pound is one of the most volatile currencies and has the potential to experience the greatest falls and the highest ups. The primary interest rate has been raised by the Bank of England numerous times, but the pound has not benefited from these increases. The market's complete disregard for the British Central Bank's hike in the primary interest rate is astonishing. However, nothing in the market is unexpected or impossibly difficult. You should constantly be ready for everything and not pass out when making some extremely powerful motions. The ending of July at 1.2000, and much more so below 1.1932, will significantly help players decrease the rate, according to the technical picture on the most senior timeframe. Only after a genuine breakdown of the resistance levels of 1.2600 and 1.2665 is an upward scenario viable.
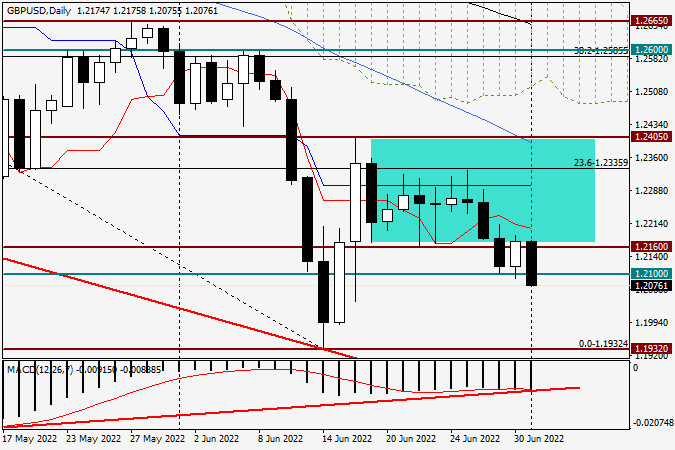
Daily
The pound/dollar currency pair rose throughout yesterday's trade, and the start of the higher dynamics was close to another significant and crucial technical mark of 1.2100. Today, when this piece is being finished, the opposite image is visible; the pair is trading lower and is once more attempting to move below the level of 1.2100. Despite the MACD indicator's positive divergence, it is not advantageous for players to drive up the exchange rate. The "Briton" cannot raise his head because of the potential negative consequences. But it might occur at any time. I won't disguise the fact that I anticipate that the pound will still be able to change the direction of trade in a pair with the US dollar in its favor despite the already significant decrease and the daily bullish divergence of the MACD indicator. However, I'm not recommending making any purchases; instead, you should wait for strong indications and do it weekly. It's not the most enjoyable activity to sell on the approach to the historical, technical, and psychological level of 1.2000. Therefore, I advise keeping away from the GBP/USD market for the time being.
You have already liked this post today
*บทวิเคราะห์ในตลาดที่มีการโพสต์ตรงนี้ เพียงเพื่อทำให้คุณทราบถึงข้อมูล ไม่ได้เป็นการเจาะจงถึงขั้นตอนให้คุณทำการซื้อขายตาม
ลิงก์ที่เป็นประโยชน์: บทความอื่นๆ ของฉันสามารถดูได้ในส่วนนี้ หลักสูตร InstaForex สำหรับมือใหม่ การวิเคราะห์ยอดนิยม เปิดบัญชีซื้อขาย ข้อสำคัญ: ผู้เริ่มต้นในตลาดฟอเร็กซ์จำเป็นต้องระมัดระวังอย่างมากเมื่อตัดสินใจเข้าสู่ตลาด ก่อนที่รายงานสำคัญจะถูกเผยแพร่ ควรอยู่ห่างจากตลาดเพื่อหลีกเลี่ยงการถูกผลกระทบจากความผันผวนที่เพิ่มขึ้น หากคุณตัดสินใจซื้อขายในช่วงที่มีการปล่อยข่าว ควรวางคำสั่งหยุดขาดทุนเสมอเพื่อจำกัดการขาดทุนให้น้อยที่สุด การไม่วางคำสั่งหยุดขาดทุนอาจทำให้คุณสูญเสียเงินฝากทั้งหมดได้อย่างรวดเร็ว
บนกราฟ 4 ชั่วโมง คู่เงินสินค้าโภคภัณฑ์ USD/CAD มีการเคลื่อนที่อยู่ต่ำกว่า EMA (100) และปรากฏรูปแบบ Bearish 123 พร้อมกับตำแหน่งของตัวบ่งชี้ Stochastic Oscillator ที่อยู่เหนือระดับ
ในสภาวะที่ตัวชี้วัด Stochastic Oscillator กำลังมุ่งหน้าเข้าสู่ระดับที่ 20 ซึ่งถือว่าเป็นพื้นที่ Oversold บนกราฟ 4 ชั่วโมงของคู่สกุลเงิน AUD/JPY ในอนาคตอันใกล้นี้ AUD/JPY มีแนวโน้มอ่อนตัวลงไปที่ระดับ 89.75-89.39
เมื่อวานนี้ ดัชนีความรู้สึกทางเศรษฐกิจ ZEW ของยูโรโซนสำหรับเดือนเมษายนเป็นที่น่าผิดหวัง ดัชนีได้ลดลงจาก 39.8 ในเดือนมีนาคมไปอยู่ที่ -18.5 ซึ่งต่ำกว่าการคาดการณ์ที่ 13.2 อย่างมาก เราเชื่อว่าชุมชนธุรกิจในยุโรปมีมุมมองที่เป็นจริงมากขึ้นเกี่ยวกับผลกระทบของสงครามการค้ามากกว่าสิ่งที่สื่อสารออกมา และยังมีความสงสัยเกี่ยวกับแผน "นอกงบประมาณ" ที่จะเพิ่มการผลิตด้านกลาโหม
เงินปอนด์ของอังกฤษยังคงมีแนวโน้มที่จะขึ้นต่อเนื่อง ตามสถานการณ์ที่เราได้กล่าวไว้ก่อนหน้านี้ (ดูแหล่งอ้างอิง) โดยกำลังมุ่งหน้าไปยังจุดแม่เหล็กที่ 1.3311 ซึ่งเป็นจุดตัดกับขอบด้านบนของช่องราคาขาขึ้นในกราฟรายวัน วันที่ตั้งเป้าหมายในการบรรลุระดับนี้คือวันที่ 17 เมษายน ซึ่งเป็นวันที่ธนาคารกลางยุโรปตัดสินใจเกี่ยวกับอัตราดอกเบี้ย การประชุมนี้น่าจะเป็นเหตุการณ์สำคัญของสัปดาห์นี้ โดยอาจมีเซอร์ไพรส์จากธนาคารกลาง เราไม่สามารถตัดความเป็นไปได้ของการลดอัตราดอกเบี้ยอย่างรุนแรงมากขึ้นในบริบทของ "สงครามภาษี" บนกราฟสี่ชั่วโมง
ในกราฟรายวัน ราคามีรูปแบบสามเหลี่ยมเล็กๆ รอบๆ ระดับ 143.45 และมีการคงตัวต่ำกว่าระดับดังกล่าว เนื่องจากเป้าหมายใกล้ที่สุดที่ 141.70 นั้นใกล้เคียง ราคาในขณะนี้จึงมุ่งเป้าหมายที่ระดับต่ำกว่า คือ 139.59 (จุดต่ำสุดจากวันที่ 30 กันยายน
ในช่วงต้นของเซสชั่นอเมริกา ราคาทองคำอยู่ที่ประมาณ 3,220 ซึ่งแสดงสัญญาณของการเริ่มอ่อนแรง มีความเป็นไปได้ในช่วงชั่วโมงข้างหน้าที่จะมีการปรับทางเทคนิคไปยัง 21SMA บนกราฟ H4 เราจะเห็นได้ว่าทองคำกำลังซื้อขายอยู่ในกรอบแนวโน้มขาลงที่เกิดขึ้นเมื่อวันที่ 10 เมษายน มีความเป็นไปได้ว่าในชั่วโมงข้างหน้า ราคาทองคำอาจลดลงสู่ 3,202 และอาจถึงจุดต่ำสุดของกรอบแนวโน้มขาลงที่ประมาณ
บนชาร์ทรายการต่อชั่วโมง, คู่ GBP/USD ยังคงเพิ่มขึ้นในวันจันทร์และรักษาตำแหน่งเหนือระดับ 1.3139 ดังนั้น, การเคลื่อนไหวทางขึ้นอาจจะยังคงเป็นไปได้ไปยังระดับการแก้ไข Fibonacci ถัดไปที่ 161.8% – 1.3249 การตีกลับจากระดับนี้จะเป็นประโยชน์ต่อดอลลาร์สหรัฐฯ และนำไปสู่การลดลงไปที่ 1.3139
ในวันจันทร์ คู่เงิน EUR/USD ยังคงปรับตัวเพิ่มขึ้น แต่ภายในวันกลับลงมาที่ระดับ 261.8% ของ Fibonacci retracement ที่ 1.1318 การดึงกลับสองครั้งจากระดับนี้ทำให้เทรดเดอร์คาดหวังการกลับตัวที่สนับสนุนยูโรและการกลับมาเติบโตต่อไปที่ระดับ Fibonacci 323.6% ที่
ลิงก์ที่เป็นประโยชน์: บทความอื่น ๆ ของฉันสามารถดูได้ในส่วนนี้ หลักสูตร InstaForex สำหรับผู้เริ่มต้น การวิเคราะห์ยอดนิยม เปิดบัญชีซื้อขาย ที่สำคัญ: ผู้เริ่มต้นในตลาด Forex ควรระมัดระวังอย่างมากเมื่อตัดสินใจเกี่ยวกับการเข้าสู่ตลาด ก่อนการเผยแพร่รายงานที่สำคัญ ควรจะหลีกเลี่ยงการเข้าเทรดในตลาดเพื่อลดความเสี่ยงจากความผันผวนของตลาดที่อาจเกิดขึ้นหากมีความผันผวนเพิ่มขึ้น
รูปแบบกราฟฟิก
ตัวบ่งชี้
เห็นบางอย่างรึเปล่า
คุณจะไม่เห็นมัน
ตารางของ Forex
เวอร์ชั่นแบบ หน้าเว็บไซต์

Your IP address shows that you are currently located in the USA. If you are a resident of the United States, you are prohibited from using the services of InstaFintech Group including online trading, online transfers, deposit/withdrawal of funds, etc.
If you think you are seeing this message by mistake and your location is not the US, kindly proceed to the website. Otherwise, you must leave the website in order to comply with government restrictions.
Why does your IP address show your location as the USA?
Please confirm whether you are a US resident or not by clicking the relevant button below. If you choose the wrong option, being a US resident, you will not be able to open an account with InstaTrade anyway.
We are sorry for any inconvenience caused by this message.


