อ่านรายละเอียดเพิ่มเติม


 27.05.2022 10:49 AM
As predicted in my previous review on EUR/USD, the most popular currency pair on Forex developed an upward movement yesterday. This means that market participants have quickly digested the FOMC minutes and resumed the bullish scenario. The fundamental factors also supported the euro bulls. Yesterday, the revised data on US GDP for the first quarter turned out to be below the estimate of -1.3% and actually stood at -1.5%. Against this backdrop, many investors feared that the US Federal Reserve may revise its aggressive approach towards monetary policy and start to ease it.
It is well known that the best way to tackle high inflation is to raise interest rates. However, this method works only when the economy is strong and everything goes according to the Fed's plan. Yesterday's data on GDP in the US showed once again that the world's leading economy is not doing well. Besides, the next two rate hikes of 50 basis points have most likely been priced in by the USD market players. Before moving on to the technical review, let me remind you that today we expect a block of macroeconomic data from the US later in the afternoon. This will include the data on personal income and spending as well as the core personal consumption expenditures price index.
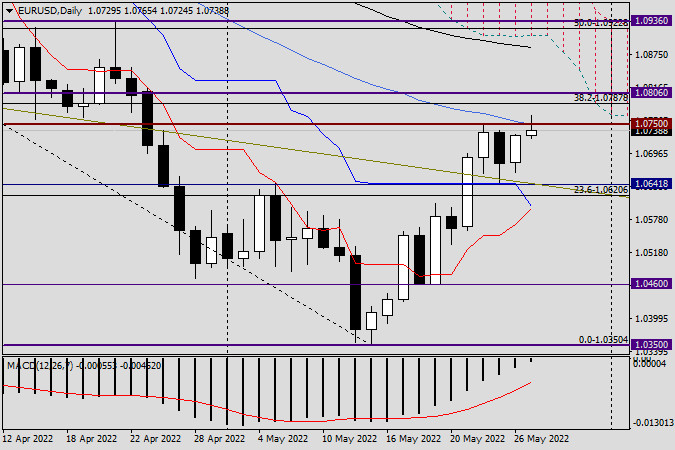
Daily chart
The bullish candlestick from yesterday with a closing price of 1.0729 was a natural transition from the previous black candlestick with a long lower shadow. On May 25, EUR/USD made an accurate pullback to the broken resistance of 1.0641 and then, following the rules of technical analysis, reversed to the upside. At the moment of writing, the euro bulls have already made an attempt to break above the 50-day simple moving average and the strong resistance level of 1.0750. These attempts have failed so far as the price made a downside pullback from this level and the 50-day MA, even though this movement was very weak. If the pair closes the day above 1.0750, this will certainly confirm the bullish scenario, and a close of the weekly session above 1.0767 will further strengthen it. I will talk about this in more detail on Monday. In case a bearish candlestick pattern appears on the daily chart by the end of the day, the quote may struggle to overcome the 50-day MA and the levels of 1 1.0750 and 1.0767 or may even stop doing this.
Trading recommendations. I usually do not recommend opening new positions on Friday so that they are rolled over to Monday. Despite the fact that the bullish scenario is very likely, it is not a good idea to open buy trades under strong resistance levels such as the 50-day MA and the levels of 1.0750 and1.0767. I advise you to stay out of the market today as this is also an option. We will provide a more detailed technical analysis of EUR/USD on Monday based on the result of the weekly session.
Have a good day!
You have already liked this post today
*บทวิเคราะห์ในตลาดที่มีการโพสต์ตรงนี้ เพียงเพื่อทำให้คุณทราบถึงข้อมูล ไม่ได้เป็นการเจาะจงถึงขั้นตอนให้คุณทำการซื้อขายตาม
ในช่วงต้นของเซสชั่นอเมริกา คู่สกุลเงิน EUR/USD กำลังซื้อขายอยู่ที่ระดับ 1.1358 ภายในช่องแนวโน้มขาลงที่เริ่มเมื่อวันที่ 18 เมษายน คู่สกุลเงินนี้ยังถูกกดดันจากแรงขาย เราเชื่อว่าเครื่องมือการเงินนี้ยังมีทางลงอีกยาวไกลกว่าจะถึงก้นของช่องแนวโน้มขาลง ยูโรคาดว่าจะฟื้นตัวในชั่วโมงต่อๆ ไป และขึ้นไปถึงระดับ 1.1429 บนกราฟ
ลิงก์ที่มีประโยชน์: บทความอื่นๆ ของฉันสามารถอ่านได้ในส่วนนี้ คอร์ส InstaForex สำหรับผู้เริ่มต้น การวิเคราะห์ยอดนิยม เปิดบัญชีซื้อขาย สำคัญ: นักลงทุนมือใหม่ในตลาดฟอเร็กซ์จำเป็นต้องระมัดระวังอย่างมากเมื่อตัดสินใจเข้าตลาด ก่อนการเปิดเผยรายงานสำคัญควรหลีกเลี่ยงการเข้าไปในตลาดเพื่อหลบเลี่ยงความผันผวนที่รุนแรง อันเนื่องมาจากความผันแปรที่เพิ่มขึ้น หากคุณตัดสินใจที่จะเทรดในช่วงที่มีการเผยแพร่ข่าวสาร ควรตั้งคำสั่งหยุดขาดทุนเสมอเพื่อช่วยลดความเสี่ยงในการขาดทุน หากไม่มีการตั้งคำสั่งหยุดขาดทุน
ราคาทองคำได้ปรับตัวลดลงอย่างชัดเจนเมื่อเร็วๆ นี้ ท่ามกลางความคาดหวังในตลาดเกี่ยวกับการเริ่มต้นการเจรจาจริงระหว่างสหรัฐฯ และจีน เรื่องภาษีและการค้าภาพรวม คำแถลงของรัฐมนตรีคลัง S. Bessent ที่กล่าวว่าการทำสงครามภาษีในปัจจุบันระหว่างปักกิ่งและวอชิงตันไม่มีประโยชน์ บ่งบอกว่าการเจรจากำลังเกิดขึ้นเบื้องหลัง และอาจมีการบรรลุข้อตกลงในอนาคตอันใกล้นี้ ในทางเทคนิค ราคาของ "โลหะสีเหลือง" มีการกลับตัวลงในท้องถิ่น
ในกราฟ 4 ชั่วโมง เครื่องมือที่ใช้สำหรับการซื้อขายเงิน (Silver) แสดงให้เห็นสภาพที่กำลังแข็งแกร่งขึ้น ซึ่งยืนยันได้จากการเคลื่อนไหวของราคาเงินที่เคลื่อนที่อยู่เหนือเส้น WMA (30 Shift 2) ที่มีแนวโน้มขึ้น แต่การปรากฎของ Divergence ระหว่างการเคลื่อนที่ของราคาและตัวบ่งชี้
แม้ว่าในกราฟ 4 ชั่วโมง ดัชนี Nasdaq 100 จะอยู่ในทิศทาง Sideways แต่ช่วงช่วงนั้นค่อนข้างกว้างจึงยังมีโอกาสที่ค่อนข้างน่าสนใจในดัชนีนี้ ขณะนี้ตัวชี้วัด Stochastic Oscillator อยู่ในสภาวะ Crossing SELL
ในช่วงต้นของตลาดสหรัฐฯ ทองคำมีการซื้อขายอยู่ที่ประมาณ 3,333 ภายในช่องขาลงที่เกิดขึ้นเมื่อวันที่ 22 เมษายน XAU/USD แสดงสัญญาณของการขายเกินและกำลังกระเด้งหลังจากถึงระดับ Murray 6/8 และพื้นที่ 200 EMA ทองคำอาจจะยังคงอยู่ในแนวโน้มขาลง ถ้ามันลดลงต่ำกว่า
ด้วยการเกิดความแตกต่างระหว่างการเคลื่อนไหวของราคาในคู่สกุลเงิน AUD/JPY กับตัวบ่งชี้ Stochastic Oscillator และการเคลื่อนไหวของราคา AUD/JPY ที่อยู่เหนือ WMA (30 Shift 2) ซึ่งมีแนวโน้มสูงขึ้น ดังนั้นอิงตามข้อเท็จจริงทั้งสองข้อนี้ AUD/JPY
หากเราพิจารณากราฟ 4 ชั่วโมง จะเห็นว่าเครื่องมือการเงิน Gold ยังคงเคลื่อนไหวในแนวโน้ม Bullish แต่การปรากฏของ Divergence ระหว่างการเคลื่อนไหวของราคาทองคำกับตัวชี้วัด Stochastic Oscillator บ่งบอกว่าในอนาคตอันใกล้นี้ ทองคำอาจเผชิญการปรับฐานอ่อนตัวลงไปสู่ระดับ 3310.31
ลิงก์ที่เป็นประโยชน์: บทความอื่นๆ ของฉันสามารถอ่านได้ในส่วนนี้ คอร์สพื้นฐาน InstaForex สำหรับผู้เริ่มต้น การวิเคราะห์ยอดนิยม เปิดบัญชีซื้อขาย สำคัญ: สำหรับผู้เริ่มต้นในการเทรดฟอเร็กซ์ ควรระมัดระวังเป็นพิเศษเมื่อทำการตัดสินใจเกี่ยวกับการเข้าสู่ตลาด ก่อนที่รายงานสำคัญจะออก ควรหลีกเลี่ยงการเข้าตลาดเพื่อป้องกันการถูกกระทบจากความผันผวนของตลาดที่เพิ่มขึ้น หากตัดสินใจเทรดในช่วงที่มีการประกาศข่าว ควรตั้ง
หากเราพิจารณากราฟ 4 ชั่วโมงของคู่สกุลเงิน GBP/CHF จะพบข้อเท็จจริงที่น่าสนใจหลายประการ ประการแรก การปรากฏตัวของรูปแบบ Triangle ตามด้วยการเคลื่อนไหวของ EMA (21) ที่เคลื่อนที่ระหว่างตัวแท่งเทียนบ่งชี้ว่าสถานการณ์ปัจจุบันของ GBP/CHF กำลังเคลื่อนที่ในลักษณะ Sideways
อีเมล/SMS
การแจ้งเตือน

Your IP address shows that you are currently located in the USA. If you are a resident of the United States, you are prohibited from using the services of InstaFintech Group including online trading, online transfers, deposit/withdrawal of funds, etc.
If you think you are seeing this message by mistake and your location is not the US, kindly proceed to the website. Otherwise, you must leave the website in order to comply with government restrictions.
Why does your IP address show your location as the USA?
Please confirm whether you are a US resident or not by clicking the relevant button below. If you choose the wrong option, being a US resident, you will not be able to open an account with InstaTrade anyway.
We are sorry for any inconvenience caused by this message.

