Vea también


 18.03.2025 09:00 AM
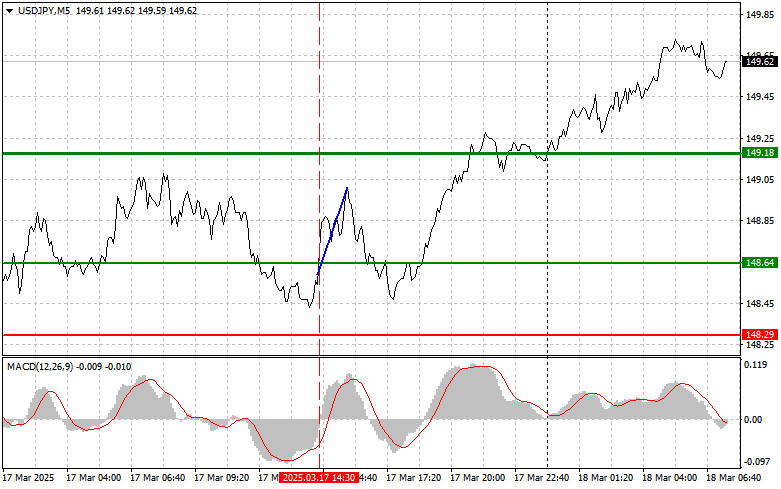
The price test at 148.64 came when the MACD indicator started moving upward from the zero mark, confirming the correct entry point to buy the dollar. As a result, the pair rose by 40 pips but could not reach the target level of 149.18 on the first attempt.
Today, data on Japan's services sector activity index was released. The figures did not support the yen, which continued the upward correction of the USD/JPY pair. The result was slightly better than the preliminary estimates but still indicated a slowdown in growth. Analysts attribute this to ongoing uncertainty in the global economy and cautious consumer sentiment in the domestic market. Despite this, the Japanese economy shows signs of resilience, supported by the export sector and government investments in infrastructure. The Bank of Japan continues to pursue a restrictive monetary policy, planning to raise interest rates further if necessary.
For intraday strategy, I will primarily rely on Scenarios #1 and #2.
Scenario #1: I plan to buy USD/JPY today when the price reaches around 149.76 (green line) with a target growth of 150.52 (thicker green line on the chart). At 150.52, I plan to exit the buy position and immediately sell in the opposite direction, expecting a 30-35 pip move back down from that level. It's best to enter buy positions during corrections and significant pullbacks in USD/JPY. Important! Before buying, ensure that the MACD indicator is above the zero mark and beginning to rise.
Scenario #2: I also plan to buy USD/JPY today in the case of two consecutive tests of 149.41 when the MACD indicator is in the oversold zone. This will limit the downside potential of the pair and lead to an upward market reversal. We can expect growth to the opposite levels of 149.76 and 150.52.
Scenario #1: I plan to sell USD/JPY today only after the 149.41 level is broken (red line on the chart), which will lead to a quick decline in the pair. The key target for sellers will be 148.75, where I plan to exit the sell position and immediately buy in the opposite direction, expecting a 20-25 pip move back up from that level. Pressure on the pair could return at any moment. Important! Before selling, ensure that the MACD indicator is below the zero mark and beginning to decline.
Scenario #2: I also plan to sell USD/JPY today if there are two consecutive tests of the 149.76 price level when the MACD indicator is in the overbought zone. This will limit the pair's upward potential and lead to a market reversal downward. We can expect a decrease to the opposite levels of 149.41 and 148.75.
You have already liked this post today
*El análisis de mercado publicado aquí tiene la finalidad de incrementar su conocimiento, más no darle instrucciones para realizar una operación.
Ayer se formó solo un punto de entrada al mercado. Veamos el gráfico de 5 minutos y analicemos lo que ocurrió allí. En mi pronóstico matutino presté atención al nivel
Desde principios de semana, el mercado del petróleo se mantiene en un equilibrio tenso. El Brent, que perdió su tendencia alcista de mayo, solo logró recuperar parcialmente la caída: tras
Ayer se formaron varios puntos de entrada al mercado. Vamos a mirar el gráfico de 5 minutos y analizar lo que ocurrió. En mi pronóstico de la mañana presté atención
Los futuros del petróleo Brent se acercaron a la zona de resistencia descendente, pero no lograron consolidarse por encima, retrocediendo hacia abajo. El panorama técnico sigue siendo tenso: el precio
El petróleo respira cambios. La política y la economía vuelven a entrelazarse en un nudo apretado, y los activos de materias primas —especialmente el petróleo y el gas— se convierten
Los futuros del petróleo Brent subieron a aproximadamente $71,3 por barril el martes, marcando la tercera sesión consecutiva de crecimiento, ya que la tensión en Medio Oriente eclipsó otros acontecimientos
El mercado bursátil vuelve a subir, con el S&P 500 en la cúspide de la euforia. ¿Qué será lo próximo? ¿Los aranceles y la política de la Reserva Federal reforzarán
El jueves, los futuros de las acciones estadounidenses permanecen prácticamente sin cambios después de un impresionante rally en la sesión de trading anterior, cuando el S&P 500 alcanzó máximos históricos
Video de entrenamiento

Your IP address shows that you are currently located in the USA. If you are a resident of the United States, you are prohibited from using the services of InstaFintech Group including online trading, online transfers, deposit/withdrawal of funds, etc.
If you think you are seeing this message by mistake and your location is not the US, kindly proceed to the website. Otherwise, you must leave the website in order to comply with government restrictions.
Why does your IP address show your location as the USA?
Please confirm whether you are a US resident or not by clicking the relevant button below. If you choose the wrong option, being a US resident, you will not be able to open an account with InstaTrade anyway.
We are sorry for any inconvenience caused by this message.


