Vea también

 22.10.2024 03:20 AM
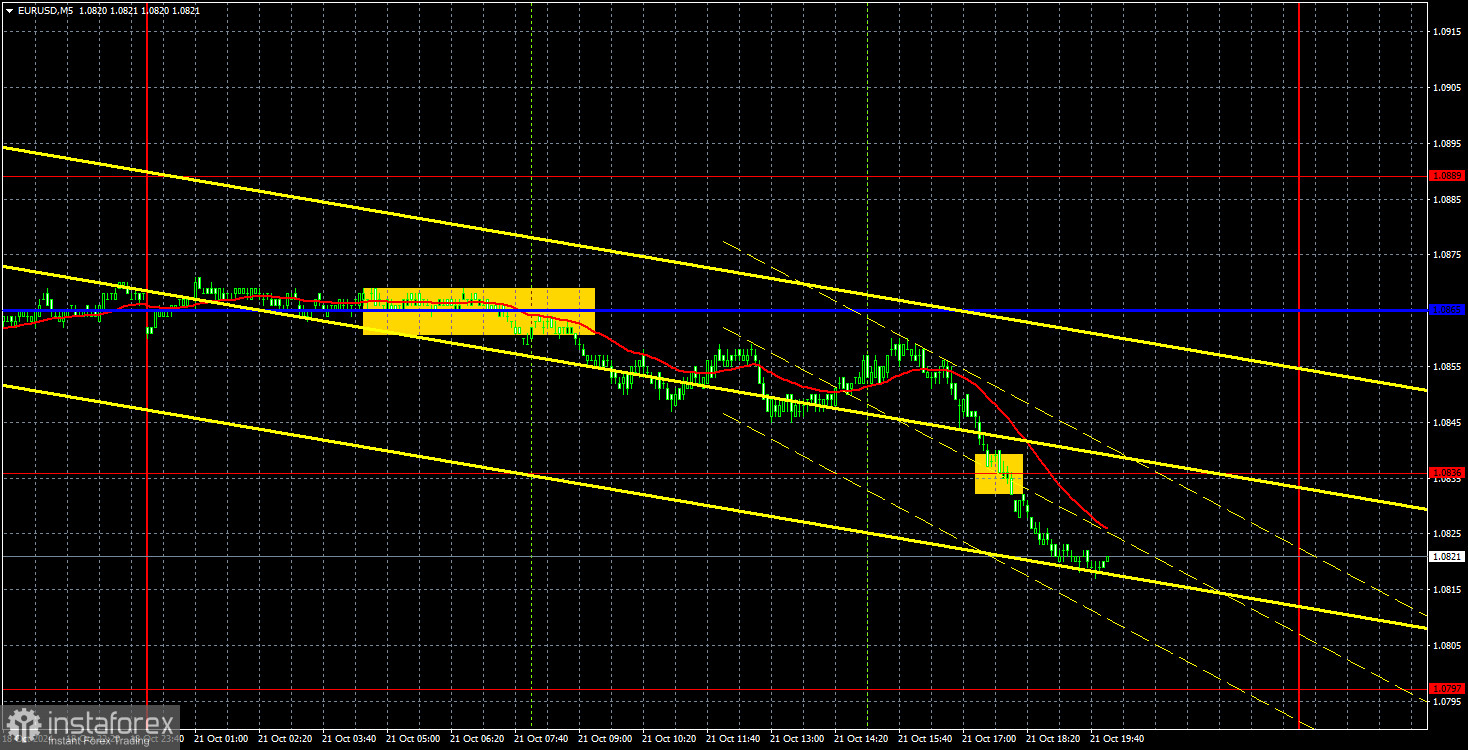
On Monday, the EUR/USD currency pair continued its steady downward movement. At the end of last week, the price made a slight upward correction, but this move can hardly be called a "correction." Monday showed that the market is not inclined toward pauses or corrections. If, even on the first trading day of the week, the euro declined with an empty economic calendar, it reflects the current market sentiment. We have repeatedly warned traders about the euro's overbought condition and unjustified high price. The euro appreciated throughout 2024 much more often than what fundamentals and macroeconomic factors warranted. And now, the time of reckoning has arrived. While one could argue that the market has begun to respond to the more dovish rhetoric of European Central Bank representatives, it's worth asking why it largely ignored the weak EU economy or the upcoming ECB rate cuts for most of this year. These factors were as evident as the anticipated easing of the Federal Reserve's policy.
Thus, the current drop in quotations does not surprise us. A correction does not have to start because the previous movement was "strong enough." Theoretically, the pair could decline by another 400 pips before beginning a correction. Moreover, at this time, there are no technical signals for buying. The pair has not even managed to hold above the trend line. Therefore, there are certainly no reasons to buy at this moment.
On Monday, two trading signals were formed. First, the pair settled below the Kijun-sen line, or rather, "detached" from it. Midway through the US trading session, it broke through the 1.0836 level. Thus, traders could open short positions in the morning. By evening, those positions could have been closed, as a correction in the pair is still anticipated, and the trade was profitable. Yet, the euro might continue its decline calmly on Tuesday.
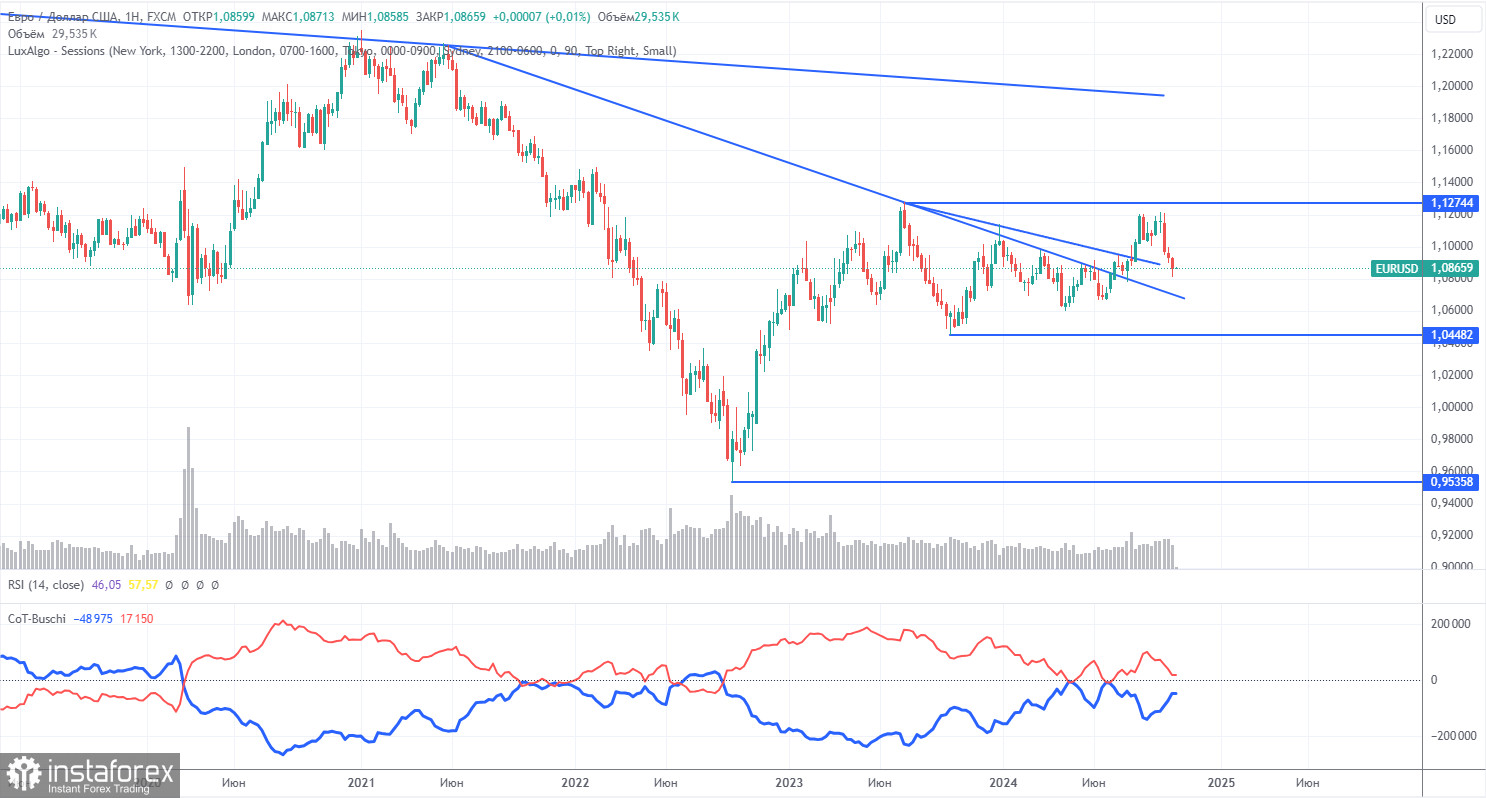
The latest COT report is dated October 15. The above illustration clearly shows that the net position of non-commercial traders has remained bullish for a long time. The bears' attempt to gain dominance failed spectacularly. The net position of non-commercial traders (red line) declined in the second half of 2023 and early 2024, while commercial traders (blue line) increased. Currently, professional players are leaning towards selling, but buyers still hold the upper hand.
We still see no fundamental factors supporting the strengthening of the euro, and technical analysis shows that the price is in a consolidation zone—in other words, a flat. On the weekly timeframe, it is evident that since December 2022, the pair has been trading between 1.0448 and 1.1274. So, from a seven-month flat, we have moved into an 18-month one. As a result, further decline remains more likely.
The red and blue lines are moving closer together, indicating an increase in short positions on the euro, which is encouraging—especially given how long the euro has been rising. Over the last reporting week, the number of longs in the non-commercial group decreased by 4,500, while shorts increased by 17,400. Accordingly, the net position declined by 21,900. The euro's potential for further decline remains strong.
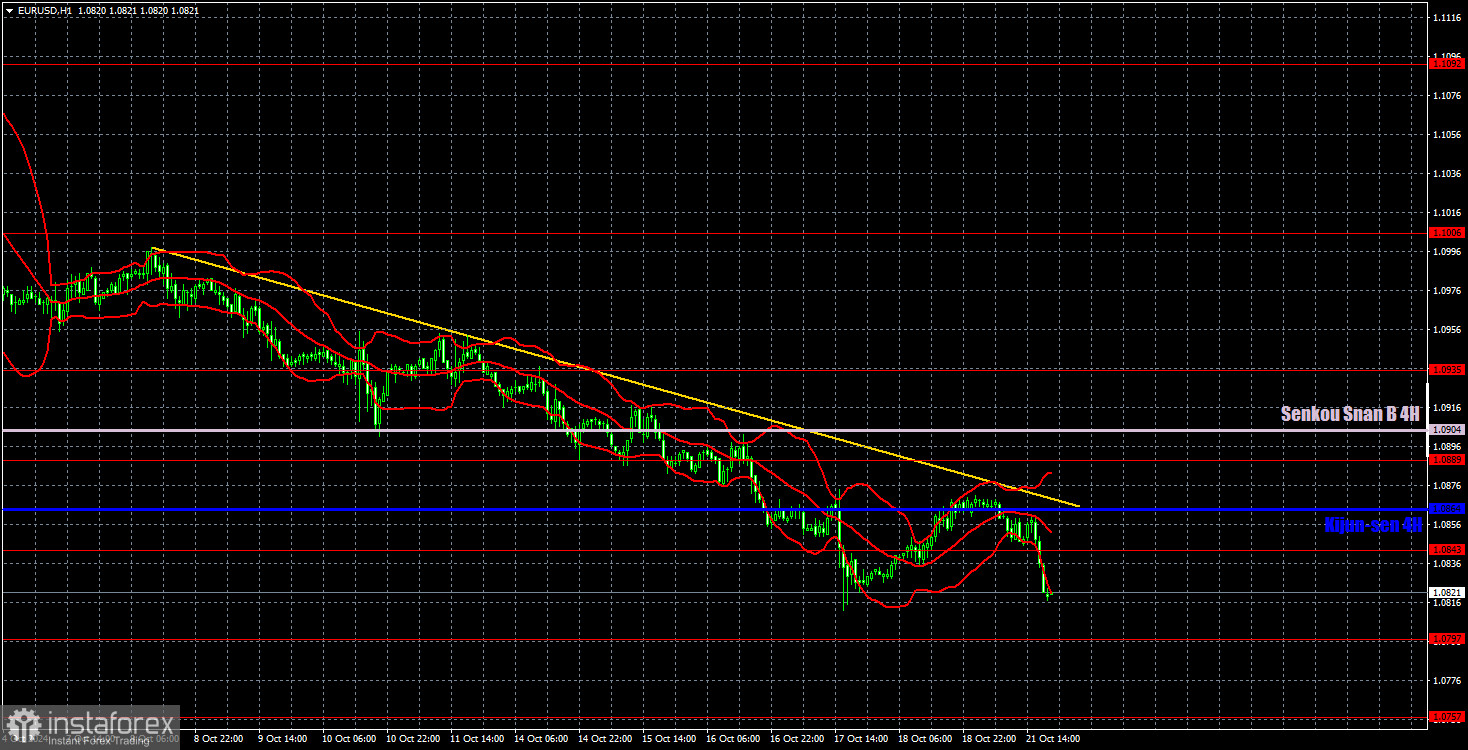
In the hourly time frame, the pair continues its downward movement, which could mark the beginning of a new, extended downtrend. There is no point in discussing the fundamental and macroeconomic reasons for the dollar's decline—they don't exist. From a medium-term perspective, we expect nothing but a decline in the euro. A short-term correction is possible, but the price must at least hold above the trend line.
We highlight the following levels for trading on October 22—1.0658-1.0669, 1.0757, 1.0797, 1.0843, 1.0889, 1.0935, 1.1006, 1.1092, 1.1147, 1.1185, 1.1234, 1.1274, as well as the Senkou Span B line (1.0904) and the Kijun-sen line (1.0864). The Ichimoku indicator lines may shift throughout the day, which should be considered when determining trading signals. Don't forget to place a Stop Loss at break even if the price moves 15 pips in the intended direction, as this will protect against potential losses if the signal turns out to be false.
Christine Lagarde will give two speeches in the Eurozone on Tuesday, but there's no guarantee she will address monetary policy. If she doesn't, we can consider the events calendar empty.
Support and resistance levels: thick red lines around which movement may end. They are not sources of trading signals.
Kijun-sen and Senkou Span B lines: Ichimoku indicator lines transferred to the hourly timeframe from the 4-hour chart. They are strong lines.
Extreme levels: thin red lines where the price previously rebounded. They are sources of trading signals.
Yellow lines: trend lines, trend channels, and other technical patterns.
Indicator 1 on COT charts: net position size of each trader category.
You have already liked this post today
*El análisis de mercado publicado aquí tiene la finalidad de incrementar su conocimiento, más no darle instrucciones para realizar una operación.


