Vea también


 13.02.2024 12:31 PM
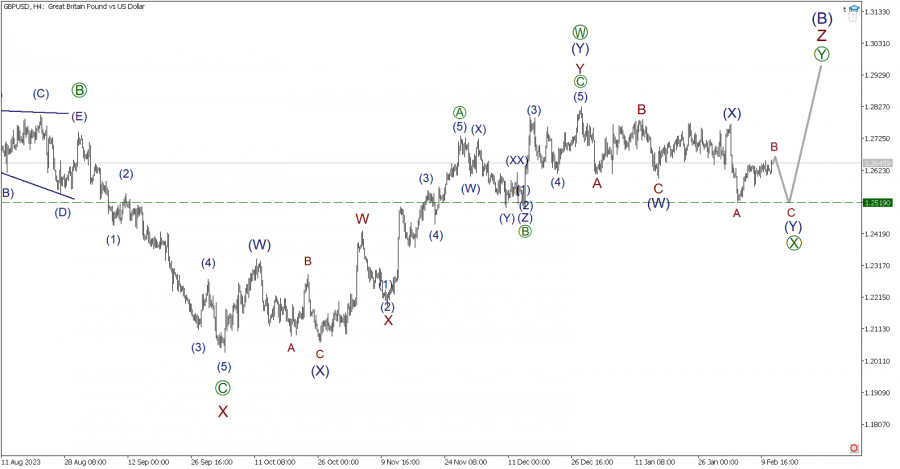
Analyzing the situation on the GBP/USD pair in a four-hour timeframe. In the long-term perspective, a significant correction (B) with a complex internal structure in the form of a triple zigzag may be forming. It is labeled with five sub-waves W-X-Y-X-Z. Currently, the last active sub-wave Z is being formed.
Based on the initial part, the active wave Z seems to take the form of a double zigzag [W]-[X]-[Y]. At the moment, only the bullish wave [W] is completed, consisting of three main sub-waves (W)-(X)-(Y). Since the end of December of the previous year, the market has been moving downward in a correction connecting wave [X].
Most of the connecting wave [X] is already completed. It has the form of a double zigzag (W)-(X)-(Y), for the full completion of which a final impulse wave C is necessary. Within impulse C, the price may fall to the low of 1.2519, marked by sub-wave A. In the current situation, opening short positions can be considered.
It is worth noting today's important news in the United States, which is the Consumer Price Index for January. In recent months, these indicators have not exceeded expectations. Thus, the bearish trend may be confirmed.
Trading recommendation: Sell at 1.2645, take profit at 1.2519.
You have already liked this post today
*El análisis de mercado publicado aquí tiene la finalidad de incrementar su conocimiento, más no darle instrucciones para realizar una operación.
Lo más probable es que se esté formando una tendencia alcista mayor en el panorama global del SP500, cuya estructura es similar a la del impulso. Si nos fijamos
La estructura de ondas del instrumento GBP/USD sigue siendo bastante complicada y muy confusa. Alrededor del nivel de 1.2822, que corresponde al 23.6% de Fibonacci y está cerca del pico
El patrón de onda para el instrumento GBP/USD sigue siendo bastante complicado y confuso. Un intento exitoso de romper el nivel de Fibonacci del 50,0% en abril indicó
El patrón de onda para el instrumento GBP/USD sigue siendo bastante complicado. El intento exitoso de romper el nivel de Fibonacci del 50,0% en abril indicó que el mercado está
El patrón de onda del gráfico de 4 horas para el instrumento EUR/USD se mantiene sin cambios. En este momento, estamos observando la construcción de la onda esperada
El análisis de ondas del gráfico de 4 horas para el par euro/dólar sigue siendo bastante claro. Durante el año pasado, solo hemos visto tres estructuras onduladas que se alternan
InstaForex en cifras

Your IP address shows that you are currently located in the USA. If you are a resident of the United States, you are prohibited from using the services of InstaFintech Group including online trading, online transfers, deposit/withdrawal of funds, etc.
If you think you are seeing this message by mistake and your location is not the US, kindly proceed to the website. Otherwise, you must leave the website in order to comply with government restrictions.
Why does your IP address show your location as the USA?
Please confirm whether you are a US resident or not by clicking the relevant button below. If you choose the wrong option, being a US resident, you will not be able to open an account with InstaTrade anyway.
We are sorry for any inconvenience caused by this message.

