Corak sebenar

Bearish Symmetrical Triangle
was formed on 18.03 at 08:42:54 (UTC+0)
signal strength 1 of 5
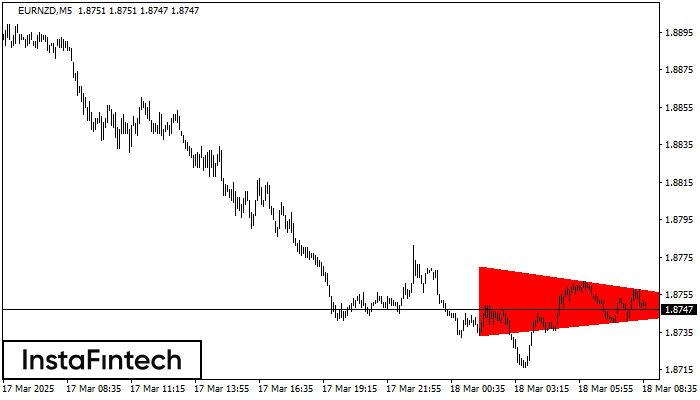
According to the chart of M5, EURNZD formed the Bearish Symmetrical Triangle pattern. Description: The lower border is 1.8733/1.8748 and upper border is 1.8770/1.8748. The pattern width is measured on the chart at -37 pips. The formation of the Bearish Symmetrical Triangle pattern evidently signals a continuation of the downward trend. In other words, if the scenario comes true and EURNZD breaches the lower border, the price could continue its move toward 1.8733.
The M5 and M15 time frames may have more false entry points.
Juga lihat
- All
- All
- Bearish Rectangle
- Bearish Symmetrical Triangle
- Bearish Symmetrical Triangle
- Bullish Rectangle
- Double Top
- Double Top
- Triple Bottom
- Triple Bottom
- Triple Top
- Triple Top
- All
- All
- Buy
- Sale
- All
- 1
- 2
- 3
- 4
- 5
Double Bottom
сформирован 01.09 в 15:10:42 (UTC+0)
сила сигнала 1 из 5
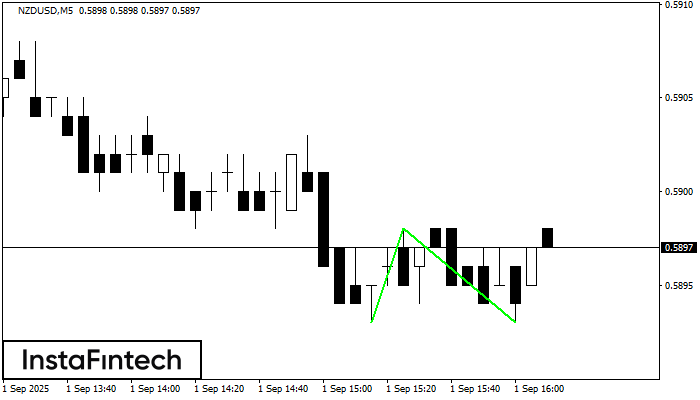
The Double Bottom pattern has been formed on NZDUSD M5. This formation signals a reversal of the trend from downwards to upwards. The signal is that a buy trade should
The M5 and M15 time frames may have more false entry points.
Открыть график инструмента в новом окне
Double Top
сформирован 01.09 в 14:30:18 (UTC+0)
сила сигнала 3 из 5
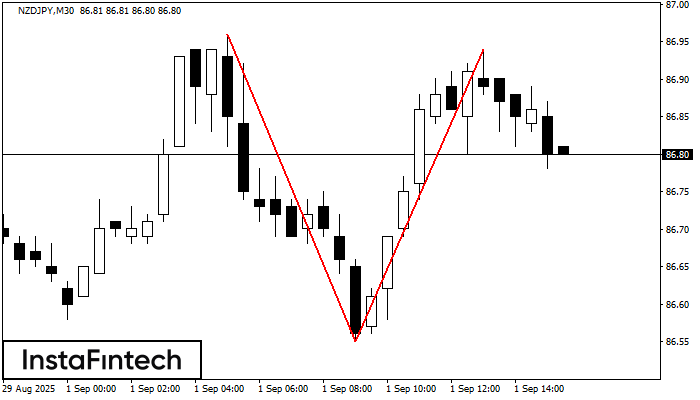
On the chart of NZDJPY M30 the Double Top reversal pattern has been formed. Characteristics: the upper boundary 86.94; the lower boundary 86.55; the width of the pattern 39 points
Открыть график инструмента в новом окне
Bullish Rectangle
сформирован 01.09 в 13:35:01 (UTC+0)
сила сигнала 1 из 5
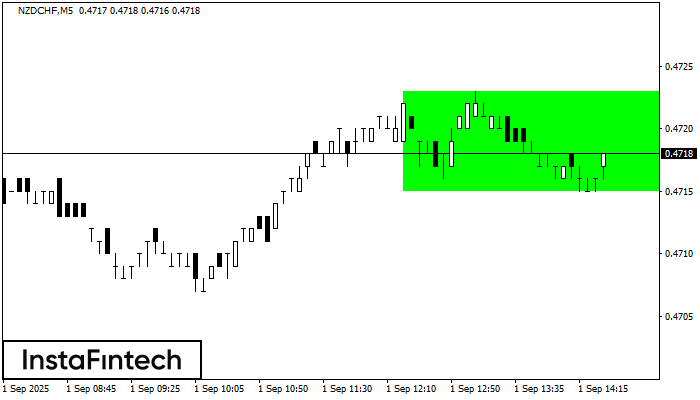
According to the chart of M5, NZDCHF formed the Bullish Rectangle which is a pattern of a trend continuation. The pattern is contained within the following borders: the lower border
The M5 and M15 time frames may have more false entry points.
Открыть график инструмента в новом окне