Lihat juga


 03.03.2025 10:35 AM
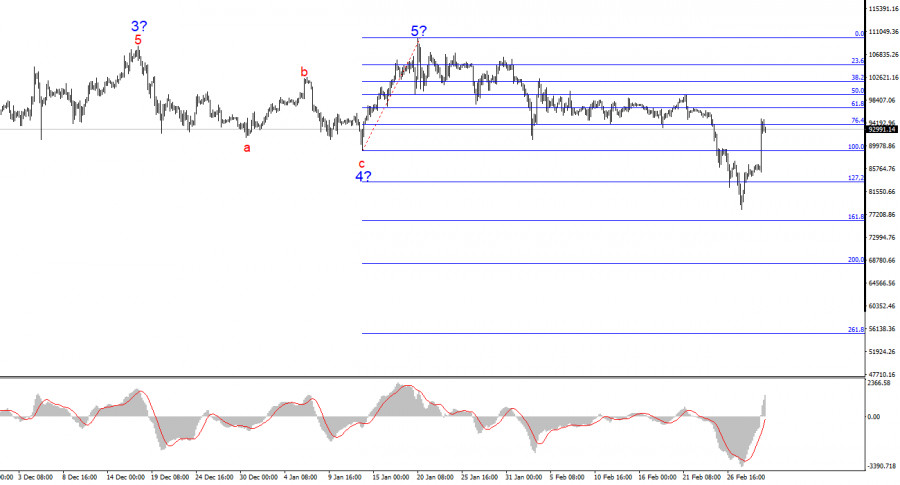
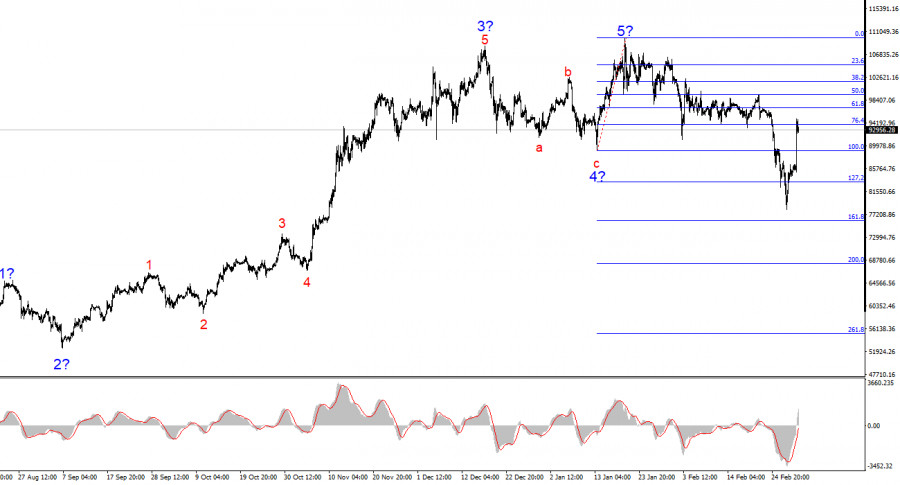
The wave structure on the 4-hour chart for BTC/USD appears clear and well-defined. Following a prolonged and complex corrective pattern (a-b-c-d-e) from March 14 to August 5, a new impulse wave began to form, adopting a five-wave structure. Given the size of the first wave, the fifth wave might have been truncated, which is why I did not and do not expect Bitcoin to rise above $110,000–$115,000 in the coming months.
Additionally, wave 4 took on a three-wave structure, confirming the accuracy of the current wave count. Bitcoin's growth was previously fueled by consistent news of institutional investments, including government allocations and pension fund purchases. However, Trump's policies forced investors to exit the market, and no trend can remain permanently bullish. The wave that began on January 20 does not resemble a typical first impulse wave, indicating that we are dealing with a complex corrective structure that could persist for months.
BTC/USD surged $8,000 in a single day, and it is not difficult to identify the reason behind this sharp rally. Donald Trump announced the creation of a U.S. crypto reserve, which would include Bitcoin, Ethereum, Solana, and XRP. However, the market was not particularly concerned with which additional cryptocurrencies would be included in a reserve that may or may not be established someday. Instead, the entire market rallied on the news. Trump further declared his intention to make America the "global capital of cryptocurrency," igniting a new wave of optimism among traders and investors.
However, the current wave structure still indicates the formation of a bearish corrective phase. This correction is likely to be complex, meaning that the decline to $77,000 was not the final drop. As I have previously mentioned, Trump, as a businessman, is unlikely to buy Bitcoin at $90,000–$100,000. The crypto market is susceptible to manipulation, and pushing Bitcoin down by tens of thousands of dollars is not an impossible task.
Thus, a further decline is inevitable due to wave structure constraints, and Trump may also attempt to significantly lower Bitcoin's price to facilitate the creation of the U.S. reserve. My expectations remain unchanged.
Based on the BTC/USD analysis, I conclude that Bitcoin's current rally is over. A complex correction appears inevitable. For this reason, I have not recommended buying Bitcoin before, and I certainly do not recommend it now. A drop below the low of wave 4 would confirm that Bitcoin is entering a bearish trend phase, likely a corrective one. Given this, the best strategy is to look for short-selling opportunities on lower timeframes. Bitcoin could decline to $76,000 (161.8% Fibonacci) and potentially to $68,000 (200.0% Fibonacci) within the coming weeks.
On the higher wave scale, a five-wave bullish structure is clearly visible. However, the market has now begun forming a bearish correction, which could either be a corrective phase or the start of a full-fledged downtrend.
You have already liked this post today
* Analisis pasaran yang disiarkan di sini adalah bertujuan untuk meningkatkan kesedaran anda, tetapi tidak untuk memberi arahan untuk membuat perdagangan.
Tekanan terhadap pasaran mata wang kripto telah kembali semalam selepas pedagang dan pelabur mencetuskan jualan besar-besaran dalam pasaran saham A.S. Seperti yang saya sering nyatakan, korelasi antara kedua-dua pasaran
Bitcoin mengukuhkan kedudukannya dengan baik, hampir mencapai paras 86,000. Ethereum juga menunjukkan peningkatan tetapi kehilangan keuntungan tersebut menjelang akhir sesi dagangan di AS. Dengan ketegangan berkaitan tarif AS yang semakin
Pada hujung minggu lepas, Bitcoin dan Ethereum menunjukkan daya tahan yang baik, mengekalkan peluang untuk pemulihan seterusnya. Walaupun dari sudut pandangan teknikal, peluang tersebut mungkin kelihatan agak tipis, berdagang dalam
Bitcoin dan Ethereum mengalami penurunan nilai menjelang penutupan sesi Amerika Syarikat pada hari Khamis tetapi pulih semula semasa waktu dagangan Asia hari ini. Adalah menjadi kebiasaan bahawa pasaran kripto menurun
Apabila berlaku perbezaan antara pergerakan harga mata wang kripto Polkadot dan penunjuk Stochastic Oscillator pada carta 4 jamnya, selagi tiada pembetulan kelemahan yang menembusi dan ditutup di bawah tahap 3.2460
Berdasarkan apa yang diperhatikan pada carta 4 jam bagi mata wang kripto Uniswap, terdapat perbezaan (divergence) antara pergerakan harga Uniswap dan penunjuk Pengayun Stochastic. Maka, berdasarkan isyarat ini, dalam masa
Bitcoin dan Ethereum kedua-duanya melonjak, meningkat antara 6% hingga 10% selepas berita bahawa Trump tiba-tiba mengubah pendiriannya. Gelombang FOMO yang kuat jelas terlihat dalam BTC selepas berita tentang jeda
Bitcoin sedang mengalami kejatuhan mendadak, dana melaporkan kerugian, dan penganalisis tidak melihat sebarang sebab untuk pertumbuhan. Apakah yang sedang berlaku dengan peneraju pasaran kripto? Apa yang perlu dilakukan dalam situasi
Bitcoin dan Ethereum mengalami kejatuhan pada penghujung hari Selasa, meneruskan penjualan besar-besaran semasa sesi dagangan Asia hari ini. Penurunan mendadak lain dalam pasaran saham Amerika Syarikat turut menyeret aset berisiko
Carta Forex
Versi-Web

Your IP address shows that you are currently located in the USA. If you are a resident of the United States, you are prohibited from using the services of InstaFintech Group including online trading, online transfers, deposit/withdrawal of funds, etc.
If you think you are seeing this message by mistake and your location is not the US, kindly proceed to the website. Otherwise, you must leave the website in order to comply with government restrictions.
Why does your IP address show your location as the USA?
Please confirm whether you are a US resident or not by clicking the relevant button below. If you choose the wrong option, being a US resident, you will not be able to open an account with InstaTrade anyway.
We are sorry for any inconvenience caused by this message.


