Lihat juga

 22.10.2024 04:58 PM
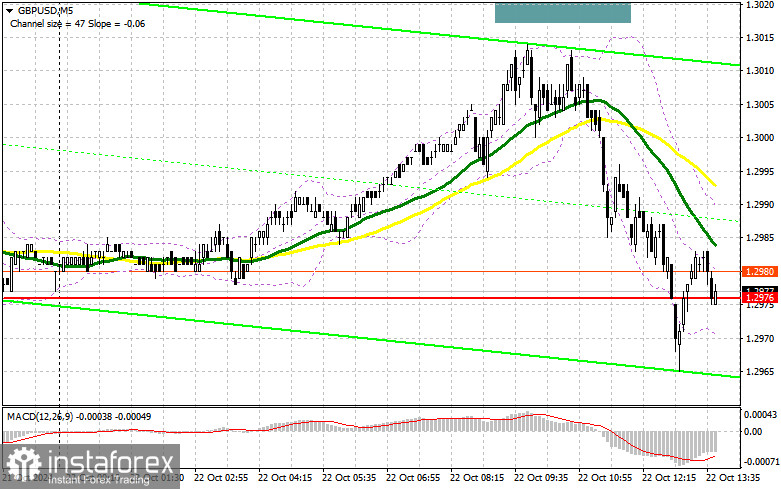
In my morning forecast, I highlighted the 1.3020 level and planned to make trading decisions from there. Let us examine the 5-minute chart to see what happened. There was an upward movement, but it fell a few points short of testing this level, so I ended up without any trades. I revised the technical outlook for the second half of the day, as the morning support at 1.2967 has weakened.
To open long positions on GBP/USD:
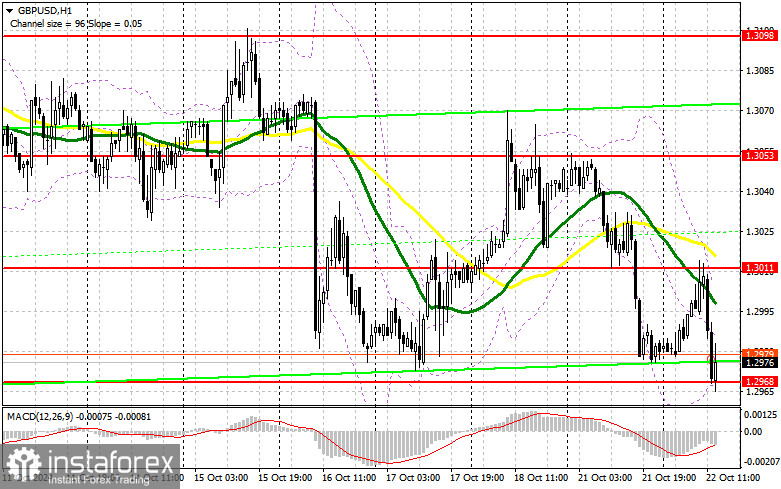
The evident attempts by the bears to push the monthly low put pound buyers in a very difficult position. If today's data on the Richmond Fed Manufacturing Index and the speech by FOMC member Patrick T. Harker favor the US dollar, which is more likely, the pair will continue to decline. Given this, it may be prudent to avoid rushing into buying. Only a false breakout around the new lower boundary of the sideways channel at 1.2968, the buyers' last hope, will offer an entry point for long positions. The target will be the new resistance at 1.3011, formed during the first half of the day. A breakout and an upward retest of this range will strengthen the chances for a bullish correction, leading to the removal of sellers' stop orders and providing a good entry point for buying, with the potential to reach the 1.3053 level. Testing this level would affect sellers' plans for further pound depreciation. The ultimate target would be the 1.3098 level, where I plan to take profits. If, in the second half of the day, GBP/USD declines and there is no buying activity around 1.2968, the bearish market will return. This would also lead to a drop and a test of the next support at 1.2941. Only a false breakout at this level would provide suitable conditions for opening long positions. I plan to buy GBP/USD on a rebound from the 1.2911 low, aiming for a 30 to 35-point upward correction during the day.
To open short positions on GBP/USD:
Sellers are confidently pressuring the pound, but they lack activity around the monthly low, casting doubt on the actions of large players. Despite trading near the monthly low, the main objective for the bears remains to defend the 1.3011 resistance, where the moving averages are aligned in their favor. A false breakout there will offer a viable opportunity for selling, targeting a decline toward the 1.2968 support, which acts as the lower boundary of the sideways channel. Therefore, a breakdown and subsequent consolidation below this range, followed by a retest from below, will strike a blow to buyers' positions, leading to the removal of stop orders and opening the path to 1.2941. The ultimate target would be the 1.2911 level, where I plan to take profits. Testing the 1.2911 level would reinforce the bearish market. If GBP/USD rises and there is no activity at 1.3011 in the second half of the day, buyers may try to regain the initiative. Bears would then have to retreat to the 1.3053 resistance area. I will sell there only on a false breakout. If there is no downward movement there either, I will look for short positions on a rebound around 1.3098, aiming for a 30 to 35-point correction.
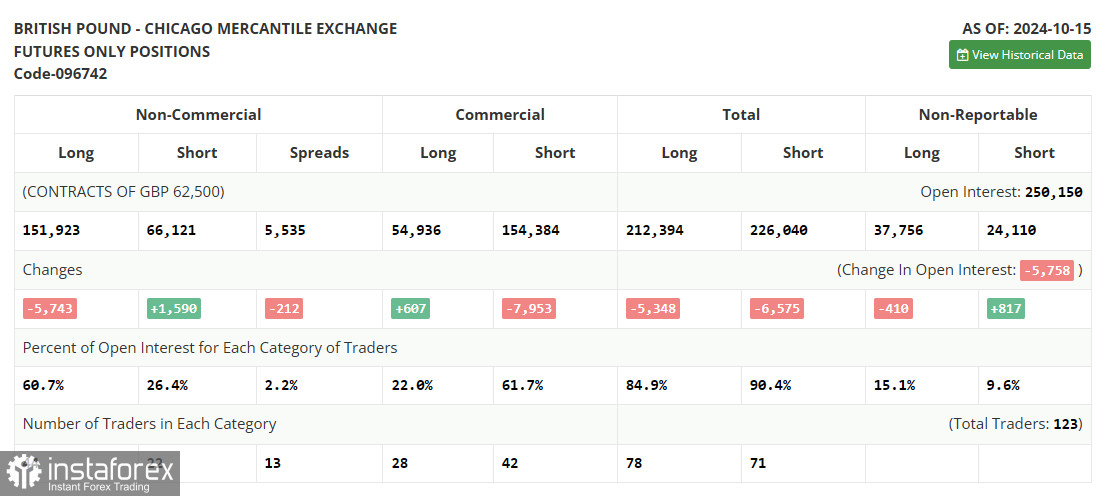
The COT (Commitment of Traders) report from October 15 showed a reduction in long positions and an increase in short positions. However, this did not significantly alter the ratio between buyers and sellers, with the former still being almost two and a half times higher. UK labor market and inflation data negatively affected the pound's upward potential, as they suggest further interest rate cuts in the UK, which is unfavorable for the national currency. This week lacks important data, so all eyes will be on statements from Bank of England representatives, which could clarify the future policy of the regulator. The latest COT report indicated that long non-commercial positions decreased by 5,743 to 151,923, while short non-commercial positions increased by 1,590 to 66,121. As a result, the gap between long and short positions narrowed by 212.
Indicator Signals:
Moving Averages:
Trading is below the 30- and 50-day moving averages, indicating further decline in the pair.
Note: The period and prices of moving averages are based on the author's analysis on the H1 hourly chart and differ from the standard definition of classic daily moving averages on the D1 daily chart.
Bollinger Bands:
In case of a decline, the lower boundary of the indicator near 1.2968 will act as support.
Indicator Descriptions:
You have already liked this post today
* Analisis pasaran yang disiarkan di sini adalah bertujuan untuk meningkatkan kesedaran anda, tetapi tidak untuk memberi arahan untuk membuat perdagangan.


