Lihat juga


 03.07.2024 04:05 PM
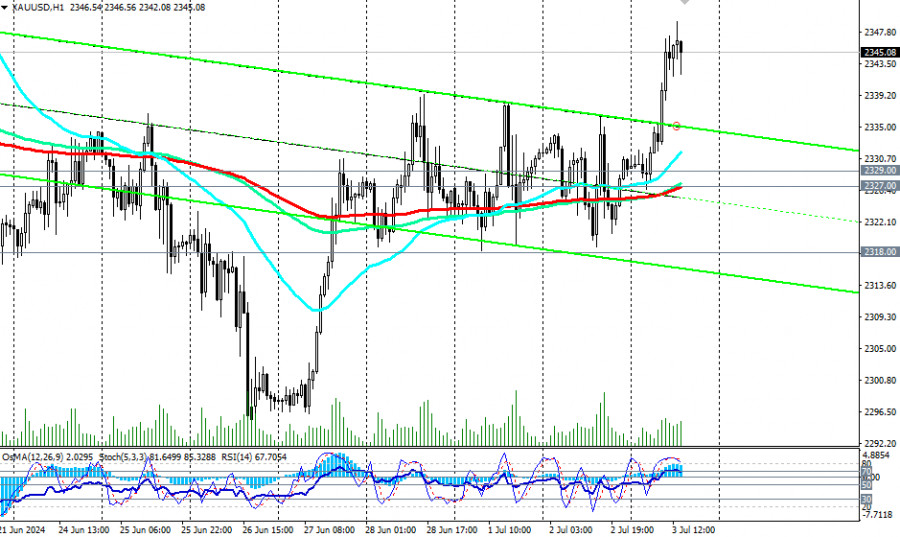
In an alternative scenario, if the 2318.00 mark is breached, the decline could continue to the lower boundary of the range and support levels at 2300.00 and 2285.00. A subsequent rebound and growth are most likely from these levels.
The dollar remains under pressure following recent publications and events.
Market participants are now awaiting Friday's labor market report, which could become a new driver for dollar movement. Forecasts suggest that +190.0 thousand new non-farm jobs were created in June, down from the previous +272.0 thousand, and the average hourly wage slowed from +4.1% to +3.9% year-over-year.
Speaking on Tuesday in Sintra, Portugal, at the annual central bank event, Fed Chair Jerome Powell said that recent data indicates a slowdown in inflation rates and its movement towards the 2.0% target, which could be achieved by the end of 2025 or in 2026.
"Inflation is moving in the right direction," and "the risks are becoming much more balanced," Powell said. His speech was deemed neutral by investors but was received with caution regarding his characterization of the national labor market as "cooling." "The labor market is cooling," Powell said, adding that "if the labor market unexpectedly weakens, it will also prompt us (the Fed) to respond."
Powell's speech intensified discussions about the possibility of the first Fed rate cut in September. Markets still expect the Fed to cut interest rates twice this year, ignoring the Fed leaders' baseline scenario, which implies only one cut.
If employment growth slows again and unemployment rises, this will be an additional argument for the Fed to transition to a more accommodative monetary policy soon.
Today, market participants are awaiting a series of important events and publications.
If these disappoint investors, we can expect a new wave of dollar weakening ahead of Friday's release of U.S. labor market data and a rise in the XAU/USD pair, as expectations of Fed monetary policy easing positively impact gold prices and negatively affect dollar quotes.
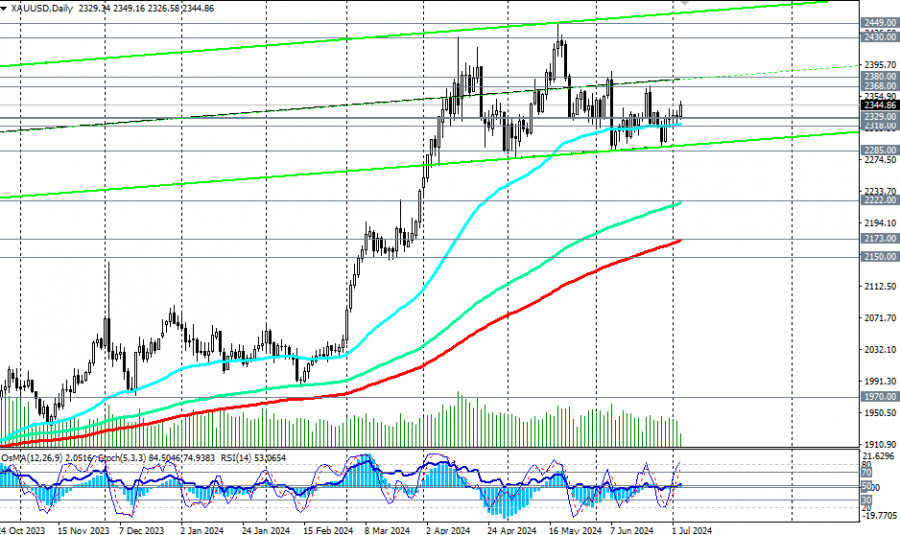
A breakthrough of today's high at 2349.00 could trigger further growth in XAU/USD, which has been unable to break away from the support level of 2318.00 (EMA50 on the daily chart) for the past month and develop a more confident upward movement.
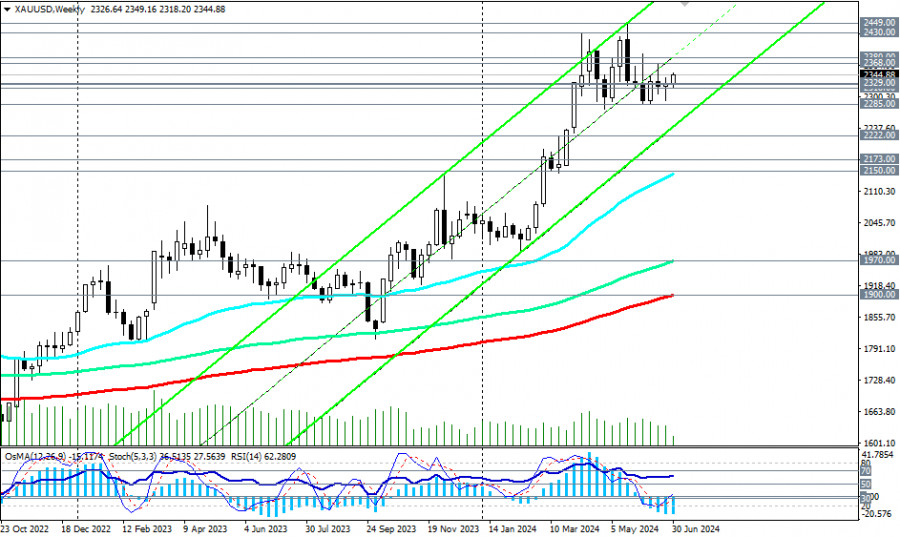
Overall, XAU/USD continues to trade in the medium- and long-term bullish markets, above the key support levels of 2173.00 (EMA200 on the daily chart) and 1900.00 (EMA200 on the weekly chart).
Therefore, from a technical standpoint, long-term and medium-term positions remain preferable.
In an alternative scenario, after breaking the 2318.00 mark, the decline could continue to the lower boundary of the range and the support levels of 2300.00 and 2285.00, from which a subsequent rebound and growth are likely.
Only a break of the key support levels at 2173.00 (EMA200 on the daily chart) and 2150.00 (EMA50 on the weekly chart) will bring XAU/USD into the medium-term bearish market zone.
Overall, the upward momentum of the XAU/USD pair prevails.
In the main scenario, we expect the resumption of growth and further increase in price towards the upper boundary of the range and the levels of 2368.00 and 2380.00. After breaking through these levels, the price could move towards 2500.00 and 2600.00. More ambitious forecasts suggest that gold prices could rise to 3000.00 dollars per ounce this year.
Support levels: 2330.00, 2329.00, 2327.00, 2318.00, 2300.00, 2285.00, 2222.00, 2173.00, 2150.00
Resistance levels: 2368.00, 2380.00, 2400.00, 2430.00, 2450.00, 2500.00, 2600.00
Trading Scenarios
Main Scenario: Buy Stop 2351.00, Stop-Loss 2339.00.
Targets: 2360.00, 2380.00, 2400.00, 2430.00, 2450.00, 2500.00, 2600.00
Alternative Scenario: Sell Stop 2339.00, Stop-Loss 2350.00
Targets: 2330.00, 2329.00, 2327.00, 2318.00, 2300.00, 2285.00, 2222.00, 2173.00, 2150.00
You have already liked this post today
* Analisis pasaran yang disiarkan di sini adalah bertujuan untuk meningkatkan kesedaran anda, tetapi tidak untuk memberi arahan untuk membuat perdagangan.
Ujian harga pada 140.68 berlaku apabila penunjuk MACD telah bergerak secara signifikan di atas garis sifar, yang pada pandangan saya, menghadkan potensi kenaikan pasangan ini. Atas sebab ini, saya tidak
Ujian pada tahap harga 1.3356 bertepatan dengan saat penunjuk MACD baru sahaja mula bergerak ke bawah dari tanda sifar, mengesahkan titik masuk yang betul untuk menjual pound. Akibatnya, pasangan
Ujian pada tahap harga 1.1460 pada separuh kedua hari itu bertepatan dengan penunjuk MACD yang mula bergerak ke bawah dari garis sifar, mengesahkan titik masuk yang betul untuk menjual euro
Euro dan Pound menjunam bersama beberapa aset sensitif risiko lain yang didagangkan dengan dolar AS—dan terdapat sebab objektif di sebalik pergerakan ini. Semalam, Donald Trump menyatakan beliau bersedia untuk mengurangkan
Minyak dan gas terus bermain mengikut peraturan politik besar. Setiap kenyataan Trump, setiap keputusan Rizab Persekutuan, dan setiap gerakan baharu dari China adalah seperti kad baharu dalam permainan tenaga yang
Analisis Dagangan dan Petua Dagangan untuk Yen Jepun Ujian pertama pada paras 140.35 berlaku tepat ketika penunjuk MACD mula bergerak naik dari garisan sifar, mengesahkan titik masuk yang sah untuk
Analisis Dagangan dan Petua Dagangan untuk Pound British Ujian pada paras 1.3394 berlaku tepat apabila penunjuk MACD mula bergerak menurun dari garisan sifar, sekali gus mengesahkan titik kemasukan pasaran yang
Analisis Dagangan dan Petua Dagangan untuk Euro Ujian pada paras 1.1521 berlaku apabila penunjuk MACD baru sahaja mula bergerak menurun dari garisan sifar, sekali gus mengesahkan titik kemasukan yang
Analisis Dagangan dan Petua Dagangan untuk Yen Jepun Tiada ujian tahap yang saya tandakan pada separuh kedua hari itu, kerana volatiliti yen menurun dengan ketara. Data hari ini menunjukkan bahawa
Analisis Dagangan dan Petua Dagangan untuk Pound British Ujian harga pada paras 1.3379 berlaku ketika penunjuk MACD telah pun berada jauh di bawah tanda sifar, yang mengehadkan potensi penurunan lanjut
Carta Forex
Versi-Web

Your IP address shows that you are currently located in the USA. If you are a resident of the United States, you are prohibited from using the services of InstaFintech Group including online trading, online transfers, deposit/withdrawal of funds, etc.
If you think you are seeing this message by mistake and your location is not the US, kindly proceed to the website. Otherwise, you must leave the website in order to comply with government restrictions.
Why does your IP address show your location as the USA?
Please confirm whether you are a US resident or not by clicking the relevant button below. If you choose the wrong option, being a US resident, you will not be able to open an account with InstaTrade anyway.
We are sorry for any inconvenience caused by this message.


