Lihat juga


 16.06.2022 02:44 PM
The GBP/USD pair showed notable growth yesterday after the US Federal Reserve raised the rate by 75 instead of 50 basis points as was previously expected. Probably, the scenario of a rate hike of 75 basis points has already been priced in by the USD traders. How else can we explain such a sell-off in the US dollar? On the other hand, the same situation happened after the two previous rate hikes. The only difference was that traders were selling the greenback because the rate increase came in line with expectations. Yesterday, however, the Fed made a more aggressive move.
Yet, it seems that the pound bulls won't celebrate this victory for too long. Today, the Bank of England is due to announce its decision on the rate which is likely to be raised by only 25 basis points. However, if the UK regulator hikes the rate by 50 basis points instead of 25, this will definitely prompt the strengthening of the British currency. A lot will depend on the meeting minutes and the rhetoric of BoE's Governor Andrew Bailey. And now let's have a look at the GBP/USD chart.
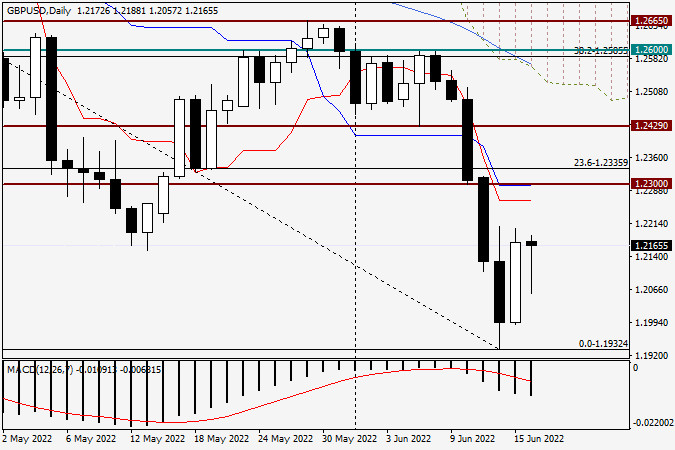
Daily chart
In yesterday's session, the pound/dollar pair notably advanced and closed the day at the level of 1.2172. Therefore, my assumptions about a corrective pullback towards 1.2200 and even 1.2300 made sense. At least, the price closely approached the level of 1.2200. Today, the pair has already pulled back to 1.2057, creating an opportunity to buy the pound. At the moment of writing, the pound/dollar pair is rapidly recovering from recent losses. Moreover, today's daily candlestick has formed a rather long lower shadow. However, when the BoE releases its decision on the rate, the technical picture for GBP/USD may change dramatically. You should keep this in mind and trade accordingly.
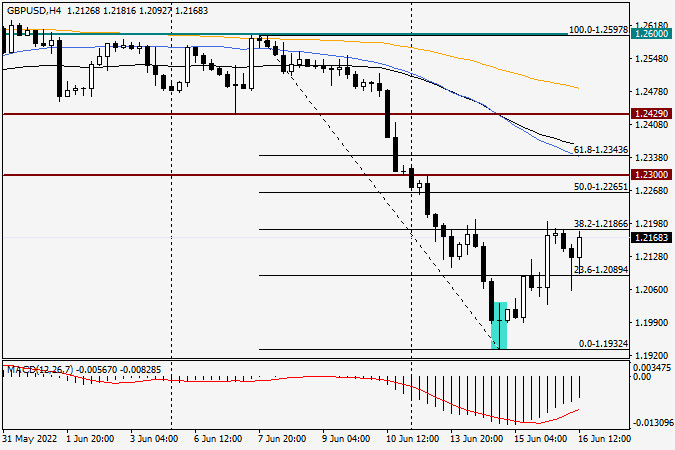
H4 chart
On the 4-hour chart, the reversal candlestick pattern called the Long-legged Doji that I mentioned yesterday has caused the required reaction in the market. In other words, traders took this signal into account, and the price began to rise. According to the Fibonacci grid stretched on a decline between 1.2597 and 1.1932, the pair managed to pull back to the 38.2 Fibonacci retracement. At this point, the price has faced strong resistance from sellers just below the level of 23.6. A very long shadow of the previous candlestick on the 4-hour chart and the current rise give hope that yesterday's uptrend can continue. It is quite obvious, though, that the trajectory of the pair today will mostly depend on the Bank of England's decision. That is why I wouldn't give any specific recommendations on trading the GBP/USD pair. One thing is for sure - today's volatility will be extremely high, so you should be very cautious.
Good luck!
You have already liked this post today
* Analisis pasaran yang disiarkan di sini adalah bertujuan untuk meningkatkan kesedaran anda, tetapi tidak untuk memberi arahan untuk membuat perdagangan.
Pada carta 4 jam, pasangan mata wang komoditi USD/CAD dapat dilihat bergerak di bawah EMA (100) dan kemunculan corak Bearish 123 serta kedudukan penunjuk Pengayun Stochastic yang sudah berada
Dengan keadaan Penunjuk Pengayun Stochastic menghampiri paras Terlebih Jual (20) pada carta 4 jam pasangan mata wang silang AUD/JPY, dalam masa terdekat AUD/JPY berpotensi untuk melemah ke kawasan paras 89.75–89.39
Pada awal sesi dagangan Amerika, emas didagangkan sekitar paras 3,220, menunjukkan tanda-tanda keletihan. Pembetulan teknikal selanjutnya ke arah Purata Bergerak Ringkas 21-hari (21 SMA) dijangka berlaku dalam beberapa jam akan
Dengan kemunculan Perbezaan antara pergerakan harga pasangan mata wang silang EUR/JPY dengan penunjuk Pengayun Stochastic Oscillator yang turut diikuti dengan kehadiran corak Bullish 123 dan diikuti oleh Bullish Ross Hook
Pada carta 4 jam, pasangan silang mata wang GBP/AUD dilihat bergerak di bawah EMA (21), dan penunjuk Pengayun Stochastic berada dalam keadaan Persilangan JUAL (Crossing SELL). Maka, berdasarkan kedua-dua maklumat
Video latihan

Your IP address shows that you are currently located in the USA. If you are a resident of the United States, you are prohibited from using the services of InstaFintech Group including online trading, online transfers, deposit/withdrawal of funds, etc.
If you think you are seeing this message by mistake and your location is not the US, kindly proceed to the website. Otherwise, you must leave the website in order to comply with government restrictions.
Why does your IP address show your location as the USA?
Please confirm whether you are a US resident or not by clicking the relevant button below. If you choose the wrong option, being a US resident, you will not be able to open an account with InstaTrade anyway.
We are sorry for any inconvenience caused by this message.


