Өзекті паттерндер

Бычий симметричный треугольник
сформирован 01.04 в 10:36:33 (UTC+0)
сила сигнала 3 из 5

По EURUSD на M30 фигура «Бычий симметричный треугольник». Характеристика: Фигура продолжения тренда; Координаты границ – верхняя 1.0849, нижняя 1.0777. Проекция ширины фигуры 72 пунктов. Прогноз: В случае пробоя верхней границы 1.0849 цена, вероятнее всего, продолжит движение к 1.0844.
Сондай-ақ қараңыз
- Все
- Все
- Bearish Rectangle
- Bearish Symmetrical Triangle
- Bearish Symmetrical Triangle
- Bullish Rectangle
- Double Top
- Double Top
- Triple Bottom
- Triple Bottom
- Triple Top
- Triple Top
- Все
- Все
- Покупка
- Продажа
- Все
- 1
- 2
- 3
- 4
- 5
Bullish pennant
was formed on 15.04 at 15:54:52 (UTC+0)
signal strength 1 of 5

The Bullish pennant graphic pattern has formed on the #MSFT M5 instrument. This pattern type falls under the category of continuation patterns. In this case, if the quote can breaks
The M5 and M15 time frames may have more false entry points.
Open chart in a new window
Double Bottom
was formed on 15.04 at 15:35:05 (UTC+0)
signal strength 1 of 5
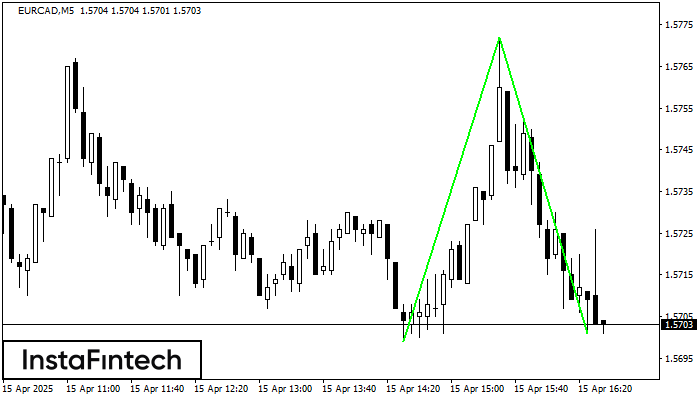
The Double Bottom pattern has been formed on EURCAD M5; the upper boundary is 1.5772; the lower boundary is 1.5701. The width of the pattern is 73 points. In case
The M5 and M15 time frames may have more false entry points.
Open chart in a new window
Bearish Symmetrical Triangle
was formed on 15.04 at 15:30:00 (UTC+0)
signal strength 4 of 5
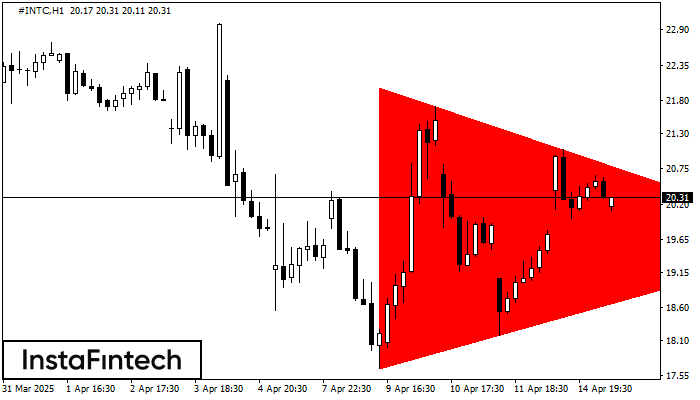
According to the chart of H1, #INTC formed the Bearish Symmetrical Triangle pattern. Trading recommendations: A breach of the lower border 17.66 is likely to encourage a continuation
Open chart in a new window