Өзекті паттерндер

Двойная вершина
сформирован 18.03 в 06:45:50 (UTC+0)
сила сигнала 1 из 5
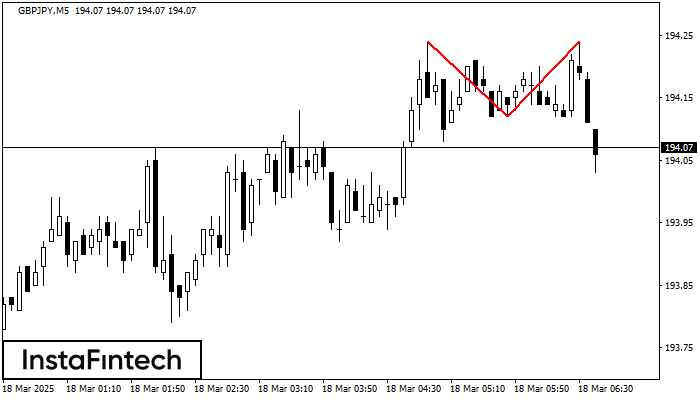
По торговому инструменту GBPJPY на M5 сформировалась фигура «Двойная вершина», которая сигнализирует нам об изменении тенденции с восходящей на нисходящую. Вероятно, что, в случае пробоя основания фигуры 194.12, возможно дальнейшее нисходящее движение.
Таймфреймы М5 и М15 могут иметь больше ложных точек входа.
Сондай-ақ қараңыз
- Все
- Все
- Bearish Rectangle
- Bearish Symmetrical Triangle
- Bearish Symmetrical Triangle
- Bullish Rectangle
- Double Top
- Double Top
- Triple Bottom
- Triple Bottom
- Triple Top
- Triple Top
- Все
- Все
- Покупка
- Продажа
- Все
- 1
- 2
- 3
- 4
- 5
Double Bottom
сформирован 01.09 в 15:10:42 (UTC+0)
сила сигнала 1 из 5
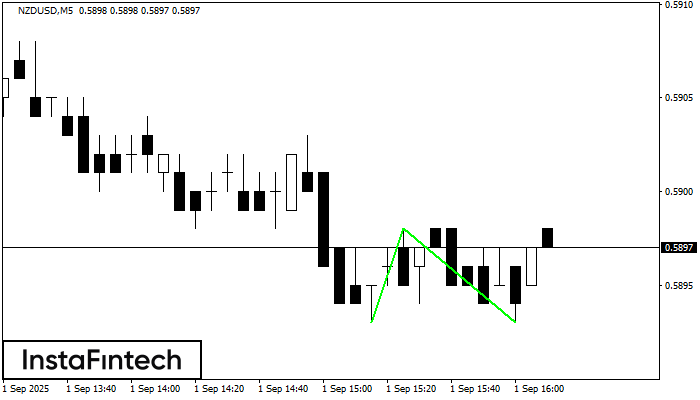
The Double Bottom pattern has been formed on NZDUSD M5. This formation signals a reversal of the trend from downwards to upwards. The signal is that a buy trade should
The M5 and M15 time frames may have more false entry points.
Открыть график инструмента в новом окне
Double Top
сформирован 01.09 в 14:30:18 (UTC+0)
сила сигнала 3 из 5
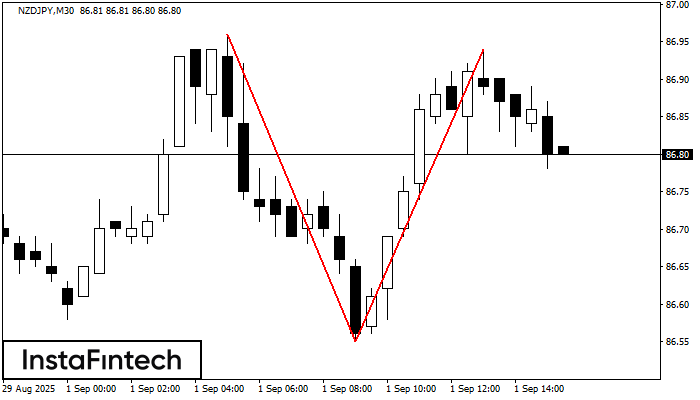
On the chart of NZDJPY M30 the Double Top reversal pattern has been formed. Characteristics: the upper boundary 86.94; the lower boundary 86.55; the width of the pattern 39 points
Открыть график инструмента в новом окне
Bullish Rectangle
сформирован 01.09 в 13:35:01 (UTC+0)
сила сигнала 1 из 5
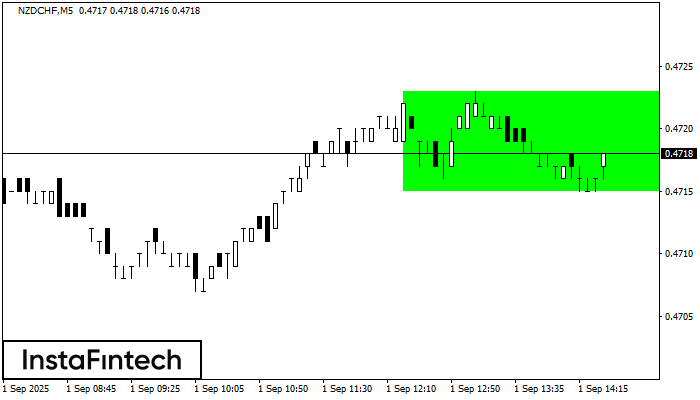
According to the chart of M5, NZDCHF formed the Bullish Rectangle which is a pattern of a trend continuation. The pattern is contained within the following borders: the lower border
The M5 and M15 time frames may have more false entry points.
Открыть график инструмента в новом окне