See also

 24.03.2025 02:22 PM
Trend Analysis (Fig. 1)
This week, the market may start moving upward from the level of 1.0815 (closing of the last weekly candle), targeting 1.0957 – the upper fractal (blue dashed line). Upon testing this level, the price may continue rising toward 1.1002 – the historical resistance level (light blue dashed line).
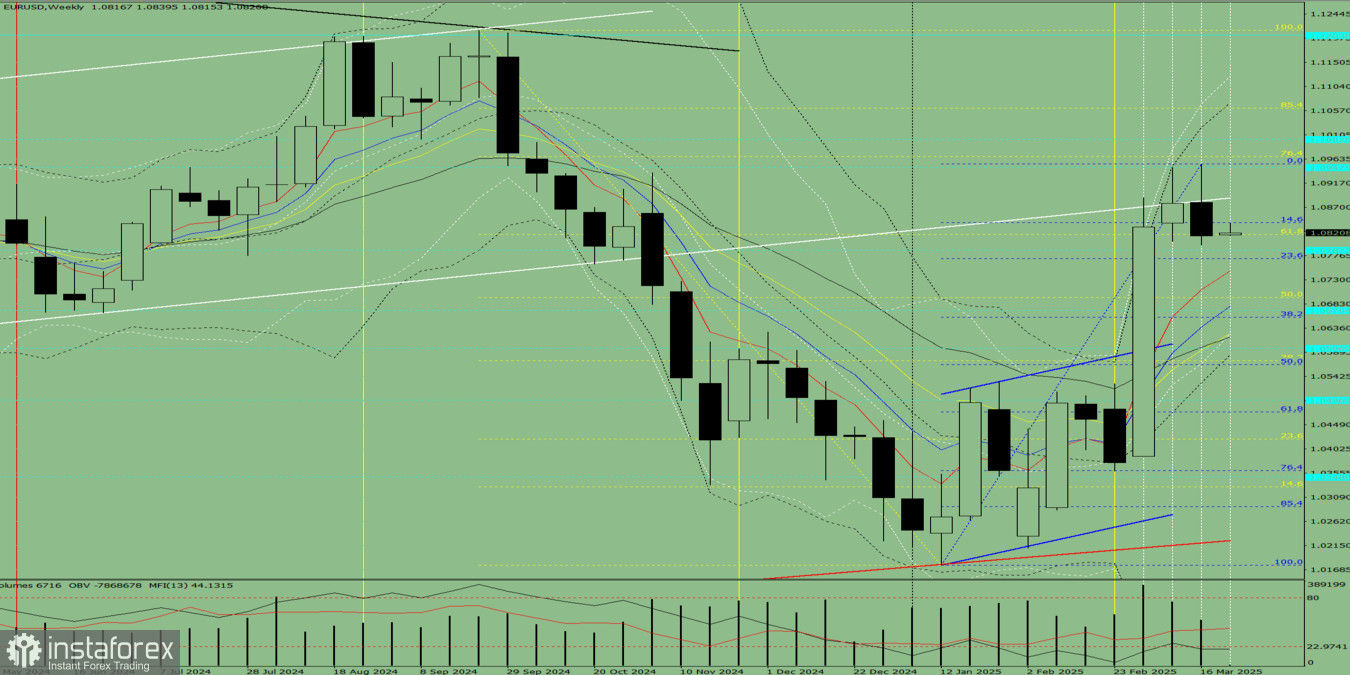
Fig. 1 (Weekly Chart)
Comprehensive Analysis:
Conclusion based on the comprehensive analysis: upward movement.
Overall forecast for the EUR/USD weekly candle: the price will most likely show an upward trend throughout the week, with no lower shadow on the weekly white candle (Monday – upward movement) and a potential upper shadow (Friday – pullback).
Alternative scenario: the pair may start moving upward from the level of 1.0815 (closing of the last weekly candle), targeting 1.0957 – the upper fractal (blue dashed line). Upon testing this level, the price may pull back downward to 1.0890 – resistance line (bold white line).
You have already liked this post today
*The market analysis posted here is meant to increase your awareness, but not to give instructions to make a trade.


