See also


 07.08.2024 04:55 PM
The wave pattern for GBP/USD remains quite complex and very ambiguous. For some time, the wave structure looked quite convincing and suggested the formation of a downward wave set with targets below the 1.23 level. However, in practice, the demand for the U.S. currency grew too strongly for this scenario to play out.
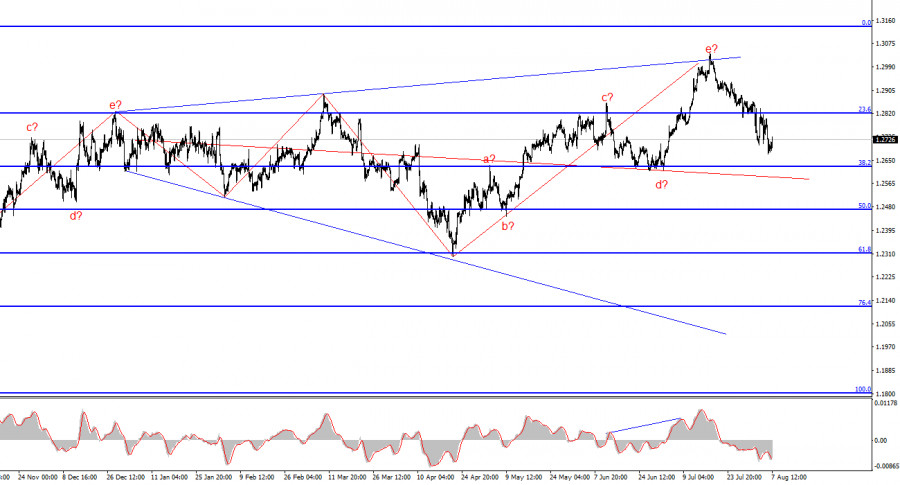
Currently, the wave pattern has become completely unreadable; in my analysis, I try to use simple structures, as complex ones have too many nuances and ambiguities. Now we see an upward wave that has overlapped a downward wave, which overlapped a previous upward wave, which overlapped a previous downward wave. The only assumption that can be made is an expanding triangle with the upper point around the 1.30 level and a balancing line around the 1.26 level. The upper line of the triangle has been reached, and the unsuccessful attempt to break it indicates the market's readiness to form a downward wave set. The unsuccessful attempt to break through the 1.2822 level, corresponding to 23.6% Fibonacci, indicates a possible resumption of the decline in the near future.
A decline of up to 130 points is likely for the pound.
The GBP/USD rate increased by 40 basis points on Wednesday, but the amplitude of movements sharply decreased today. For the second day in a row, there is no news in the U.K. and the U.S., and the market prefers to trade on strong news right now. On Monday, the drivers were rumors of a possible unscheduled Fed meeting and a sharp rate cut amid weak payrolls and unemployment reports, as well as the ISM services PMI. On Tuesday, no important information was received. Today, none as well. The market has stabilized and is awaiting new information.
Since there is no recent news, the upward five-wave structure is complete. The instrument has generated a strong sell signal near the upper line of the expanding triangle. I can only expect a decline in the British currency. The only question is how fast it will be. Obviously, after five waves up, everyone expects to see three waves down. Will the 1.26 level be reached within the first wave, or will it require more time?
By the end of the week, I do not think the 1.26 level will be reached. There will be no news in the U.K. and the U.S. on Thursday and Friday. Consequently, the market will most likely take a pause and wait for inflation reports. Once these reports are out, new forecasts for central bank actions at the September meetings can be made. I expect the Bank of England to lower the rate for the second time in a row, and I highly doubt the Fed will ease its policy.
The wave pattern for GBP/USD still suggests a decline. If an upward trend began on April 22, it would have already acquired a five-wave structure. Consequently, in any case, we should now expect at least a three-wave correction. The unsuccessful attempt to break the upper line of the triangle indicates the market's readiness to form a downward wave set. In my opinion, in the near future, sales of the instrument should be considered with targets around the 1.2627 level, which corresponds to 38.2% Fibonacci.
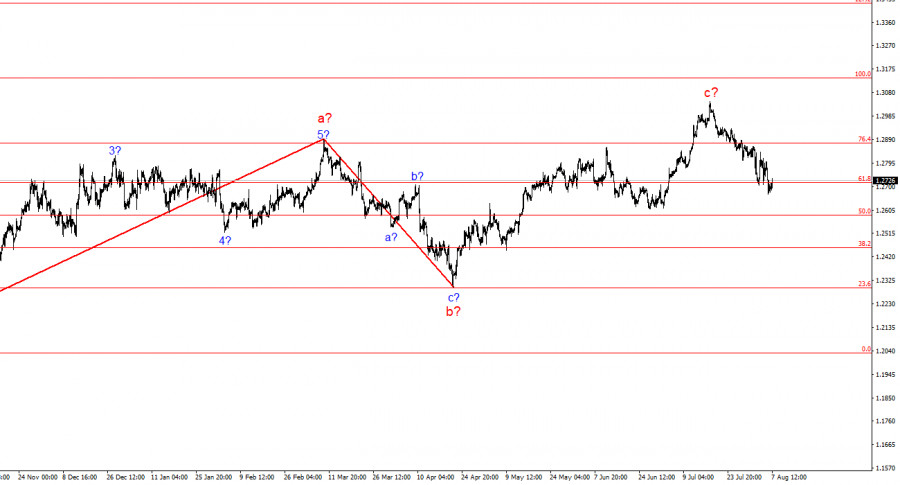
On the higher wave scale, the wave pattern has transformed. Now we can assume the construction of a complex and extended upward corrective structure. At the moment, it is a three-wave structure, but it can transform into a five-wave structure, which will take several more months, if not longer.
Key principles of my analysis:
You have already liked this post today
*The market analysis posted here is meant to increase your awareness, but not to give instructions to make a trade.
GBP/USD Analysis: On the higher time frame of the pound sterling's major pair, a bullish trend has been forming since July last year. Over the past month, an extended corrective
EUR/USD Analysis: On the 4-hour chart of the euro major pair, an upward trend has been developing since early February. The structure of the wave has been forming its final
Ferrari F8 TRIBUTO
from InstaTrade

Your IP address shows that you are currently located in the USA. If you are a resident of the United States, you are prohibited from using the services of InstaFintech Group including online trading, online transfers, deposit/withdrawal of funds, etc.
If you think you are seeing this message by mistake and your location is not the US, kindly proceed to the website. Otherwise, you must leave the website in order to comply with government restrictions.
Why does your IP address show your location as the USA?
Please confirm whether you are a US resident or not by clicking the relevant button below. If you choose the wrong option, being a US resident, you will not be able to open an account with InstaTrade anyway.
We are sorry for any inconvenience caused by this message.


