
 06.06.2022 11:53 AM
Another trading week ended, which was crowned by data on the US labor market. As expected, labor reports for May were mixed. Thus, unemployment remained at the same level of 3.6%, contrary to forecasts that it would fall to 3.5%. But the number of newly created jobs in non-agricultural sectors of the American economy (Nonfarm Payrolls) pleased investors since this most important indicator turned out to be stronger than expectations of 325 thousand and amounted to 390 thousand. In addition, the previous value was revised upward - from 428 to 436 thousand. As for average hourly wages, they increased by only 0.3%, falling short of the forecast value of 0.4%. As already noted at the very beginning of the article, in general, the data on the US labor market for the past month turned out to be ambiguous. And the forecasts of the Chairman of the Federal Reserve System (FRS) of the USA Jerome Powell that unemployment will continue to decline, and the growth in the number of new jobs will slow down a little, have not yet found their actual confirmation. Who knows, maybe in the coming months, we will see what Powell talked about, but for now, we have what we have.
Weekly
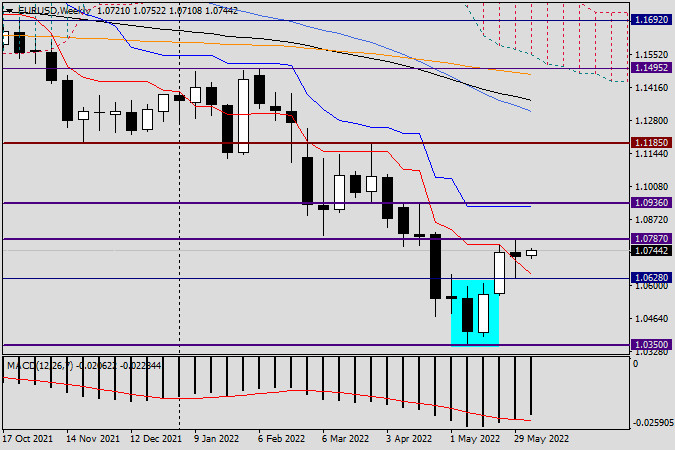
As can be seen on the EUR/USD weekly chart, the pair traded in a relatively narrow range of 1.0787-1.0628 at the last five-day auction. At the same time, none of the opposing sides managed to achieve a clear advantage. Yes, according to the results of last week's trading, the quote has slightly decreased, but this most likely does not answer the further direction of the course. It can be assumed that after a fairly good previous two-week growth, the euro bulls paused since their plans include the rise of the quote above the strong technical level of 1.0800, which has repeatedly resisted and pushed the pair down. If the players manage to pass 1.0800 for an increase in the exchange rate, we can expect further growth to the levels of 1.0860, 1.0900, and 1.0935. Near the last level, given that the blue Kijun line of the Ichimoku indicator passes at 1.0922, the euro/dollar bulls will have a particularly hard time.
However, we still need to get to these prices. The primary task of bears for this trading instrument is to return the rate below 1.0641 and 1.0628 and then leave and consolidate below 1.0600. Only under such conditions can we count on the activation of the downward scenario. Regarding the last weekly candle, I think that it does not represent anything terrible for the subsequent possible growth. Now, if such a candle appeared after a long growth, at the very end of it, then it would be another matter. And so, according to long-term observations, I can report that often such candles are blocked by growth in such a situation, that is, they are absorbed, after which they lose any threat to the subsequent rise of the quote. In this regard, the trading results of the current five-day period become very important, since they can clarify the further alignment of forces on the main currency pair of the Forex market.
Daily
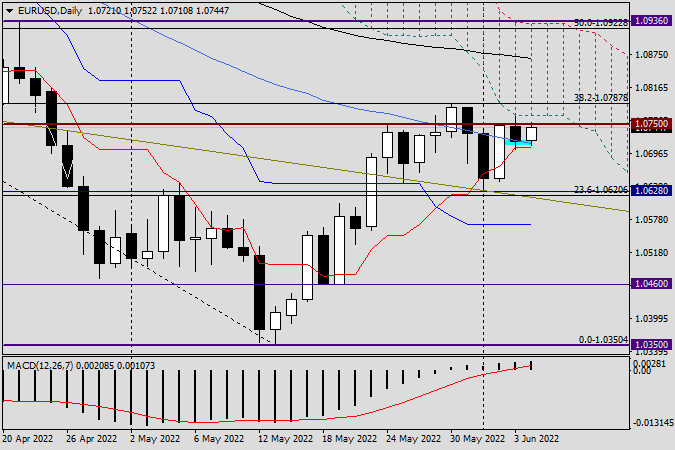
Looking at Friday's candle, we can conclude that the data on the US labor market did not give investors a clear understanding of the further direction of the quote. From a technical point of view, a slight decrease at the auction on June 3 can be explained by the price rebound from the lower boundary of the daily cloud of the Ichimoku indicator. As you can see, the Tenkan and Kijun lines kept the pair from a more significant downward movement. For trading recommendations, the situation is by no means unambiguous. According to the personal opinion of the author of this article, there will be nothing surprising in the resumption of the upward scenario, so you can look closely at purchases after the EUR/USD declines to 1.0700 and 1.0680, but before that, it is advisable to enlist the support of the corresponding candle signals at this or smaller time intervals. If bearish models of Japanese candlesticks appear in the strong technical zone 1.0750-1.0760 on the indicated timeframes, this will be a signal to open sales. And the last. While the situation is far from unambiguous, it is better to refrain from setting big goals for both purchases and sales.
图形图案
指标。
注意事项
您永远不会!
InstaForex俱乐部

Your IP address shows that you are currently located in the USA. If you are a resident of the United States, you are prohibited from using the services of InstaFintech Group including online trading, online transfers, deposit/withdrawal of funds, etc.
If you think you are seeing this message by mistake and your location is not the US, kindly proceed to the website. Otherwise, you must leave the website in order to comply with government restrictions.
Why does your IP address show your location as the USA?
Please confirm whether you are a US resident or not by clicking the relevant button below. If you choose the wrong option, being a US resident, you will not be able to open an account with InstaTrade anyway.
We are sorry for any inconvenience caused by this message.


