আরও দেখুন

 22.10.2024 06:58 PM
Analysis of Trades and Tips for Trading the Japanese Yen
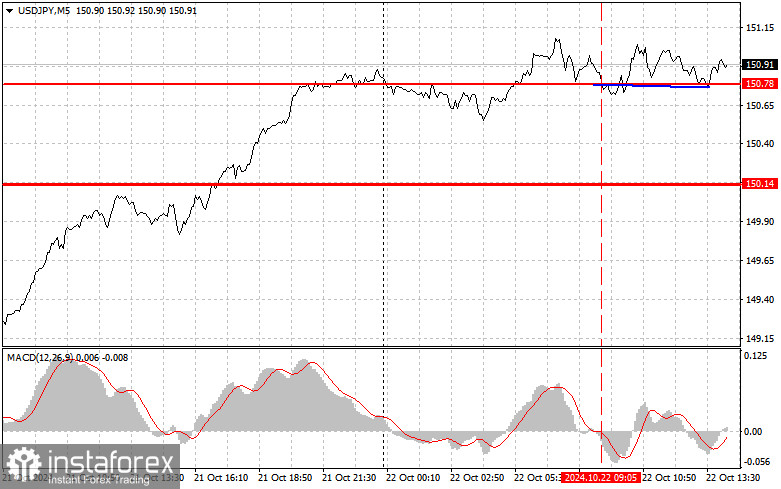
The first test of the 150.78 level occurred when the MACD indicator had just started moving down from the zero mark, confirming a proper entry point for selling the dollar. However, as shown on the chart, significant declines did not follow, allowing buyers to maintain control with the potential for further growth. This momentum could be supported in the second half of the day by the Richmond Fed Manufacturing Index data and the speech by FOMC member Patrick T. Harker, which is more significant than the earlier data. If the policymaker adopts a dovish tone, as his colleagues have recently, the USD/JPY is likely to continue rising. For the intraday strategy, I plan to implement Scenarios #1 and #2.
Buy Signal
Scenario #1: Today, I plan to buy USD/JPY if the price reaches the entry level around 151.10 (green line on the chart), targeting a rise to the 151.77 level (thicker green line on the chart). Around 151.77, I will exit the buy positions and open sell positions in the opposite direction (expecting a 30-35 point movement in the opposite direction from the level). A rise in the pair today can only be expected after hawkish statements from Fed representatives. Important: Before buying, ensure that the MACD indicator is above the zero mark and just starting to rise.
Scenario #2: I also plan to buy USD/JPY today if there are two consecutive tests of the 150.65 level when the MACD indicator is in the oversold zone. This will limit the pair's downward potential and lead to an upward reversal. A rise toward the levels of 151.10 and 151.77 can be expected.
Sell Signal
Scenario #1: I plan to sell USD/JPY today after breaking the 150.65 level (red line on the chart), which will lead to a quick decline in the pair. The key target for sellers will be the 150.14 level, where I plan to exit the sell positions and consider opening buy positions in the opposite direction (expecting a 20-25 point movement in the opposite direction from the level). Selling pressure on the pair will return if the recent daily high is breached. Important: Before selling, ensure that the MACD indicator is below the zero mark and just starting to decline.
Scenario #2: I also plan to sell USD/JPY today if there are two consecutive tests of the 151.10 level when the MACD indicator is in the overbought zone. This will limit the pair's upward potential and lead to a downward reversal. A decline toward the levels of 150.65 and 150.14 can be expected.
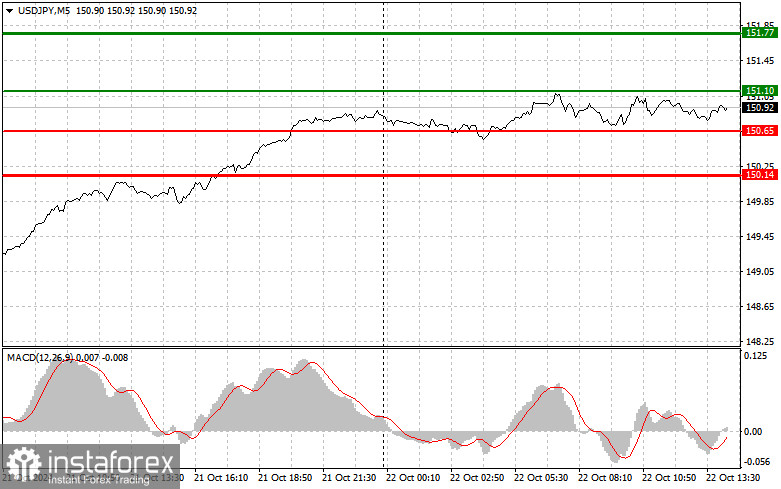
Chart Overview:
Important: Beginner traders in the forex market should make entry decisions with great caution. Before the release of important fundamental reports, it is best to stay out of the market to avoid sharp price swings. If you decide to trade during news releases, always set stop-loss orders to minimize losses. Without stop-loss orders, you can quickly lose your entire capital, especially if you do not use money management and trade large volumes.
And remember, successful trading requires a clear trading plan, like the example provided above. Making spontaneous trading decisions based on the current market situation is a losing strategy for intraday traders.
You have already liked this post today
*এখানে পোস্ট করা মার্কেট বিশ্লেষণ আপনার সচেতনতা বৃদ্ধির জন্য প্রদান করা হয়, ট্রেড করার নির্দেশনা প্রদানের জন্য প্রদান করা হয় না।


