আরও দেখুন

 22.10.2024 05:06 AM
On the daily chart of the USD/JPY pair, the final wedge (pennant) has transformed into a flag pattern. The lower boundary of the flag aligns with the support level at 149.38. A price breakout below this level opens the way to the next target at 147.22, after which the price may battle with the support range of 143.60-MACD line (144.60).
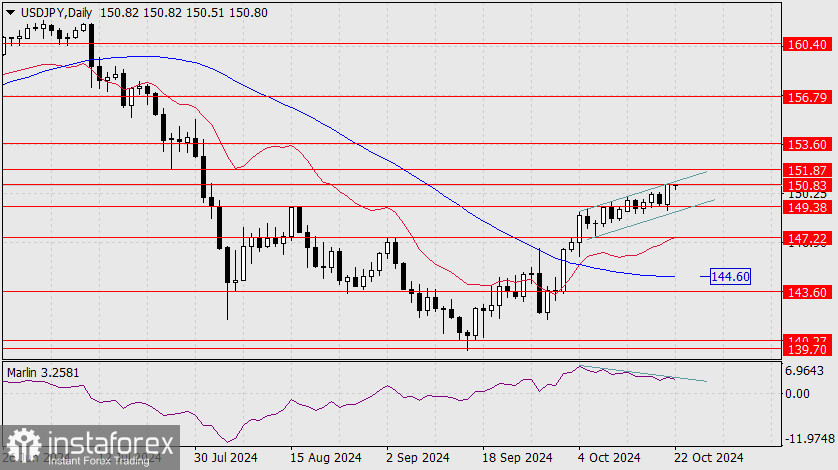
A move above the 150.83 level does not yet signal a breakout toward 151.87, as the upper boundary of the flag's pennant is just above the current resistance. The signal line of the Marlin oscillator is still moving in a downtrend. We anticipate either a break in the price trend or an upward breakout to 153.60. The main scenario remains bearish, given that the stock market is struggling to rise around its record highs.
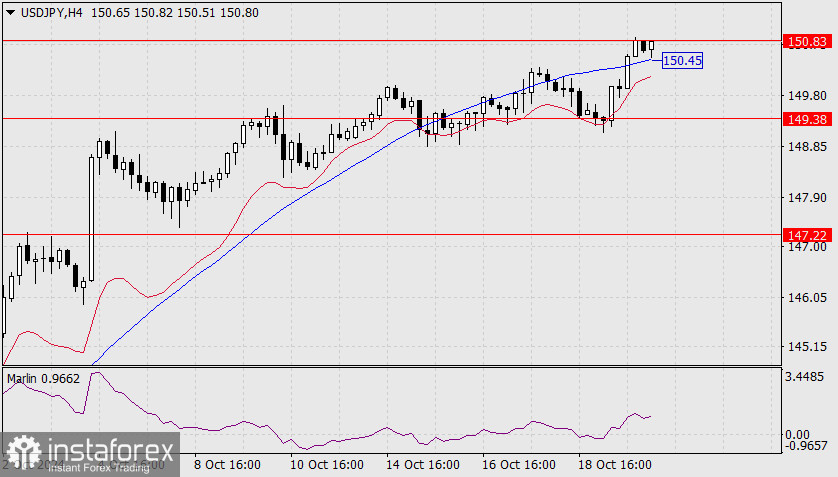
On the four-hour chart, the price has consolidated above the MACD line, but the upper boundary of the flag is preventing it from consolidating above the 150.83 level. Marlin has naturally moved upward but is currently in a secondary position in the local situation. A consolidation below the MACD line (150.45) would indicate an intention for the price to return to 149.38.
You have already liked this post today
*এখানে পোস্ট করা মার্কেট বিশ্লেষণ আপনার সচেতনতা বৃদ্ধির জন্য প্রদান করা হয়, ট্রেড করার নির্দেশনা প্রদানের জন্য প্রদান করা হয় না।


